Understanding Probability Distributions Using Dice Rolling
Explore probability distributions by rolling dice, starting with a single die and progressing to multiple dice rolls. Understand how the distribution changes as more dice are rolled and how it affects the shape of the distribution curve. Practice inferring population parameters through hypothesis testing using statistics and visualize the concept through engaging group work activities.

Download Presentation

Please find below an Image/Link to download the presentation.
The content on the website is provided AS IS for your information and personal use only. It may not be sold, licensed, or shared on other websites without obtaining consent from the author. Download presentation by click this link. If you encounter any issues during the download, it is possible that the publisher has removed the file from their server.
E N D
Presentation Transcript
IMGD 2905 Inferential Statistics Chapter 6 & 7
Overview Use statistics to infer population parameters http://3.bp.blogspot.com/_94E2PdKwaXE/S-xQRuoiKAI/AAAAAAAAABY/xvDRcG_Mcj0/s1600/120909_0159_1.png Inferential statistics
Outline Overview Foundation Inferring Population Parameters Hypothesis Testing (done) (next)
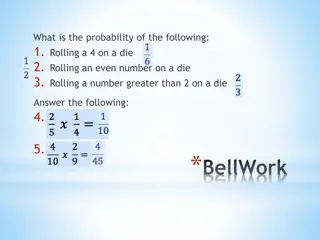
Groupwork Remember, probability distribution shows possible outcomes on x-axis and probability of each on y-axis. 1. Describe the probability distribution of 1 d6? 2. Describe the probability distribution of 2 d6? 3. Describe the probability distribution of 3 d6? Icebreaker, Groupwork, Questions https://web.cs.wpi.edu/~imgd2905/d23/groupwork/6-prob-dist/handout.html https://academo.org/demos/dice-roll-statistics/
Dice Rolling (1 of 4) Have 1d6, sample (i.e., roll 1 die) What is probability distribution of values?
Dice Rolling (1 of 4) Have 1d6, sample (i.e., roll 1 die) What is probability distribution of values? Square distribution http://www.investopedia.com/articles/06/probabilitydistribution.asp
Dice Rolling (2 of 4) Have 1d6, sample twice and sum (i.e., roll 2 dice) What is probability distribution of values?
Dice Rolling (2 of 4) Have 1d6, sample twice and sum (i.e., roll 2 dice) What is probability distribution of values? Triangle distribution http://www.investopedia.com/articles/06/probabilitydistribution.asp
Dice Rolling (3 of 4) Have 1d6, sample thrice and sum (i.e., roll 3 dice) What is probability distribution of values?
Dice Rolling (3 of 4) Have 1d6, sample thrice and sum (i.e., roll 3 dice) What is probability distribution of values? What s happening to the shape? http://www.investopedia.com/articles/06/probabilitydistribution.asp
Dice Rolling (3 of 4) Have 1d6, sample thrice and sum (i.e., roll 3 dice) What is probability distribution of values? What s happening to the shape?
Dice Rolling (4 of 4) Same holds for general experiments with dice (i.e., observing sample sum and mean of dice rolls) Resulting sum/mean follows a normal distribution Even though base distribution is uniform! http://www.muelaner.com/uncertainty-of-measurement/ Ok, neat for square distributions (e.g., d6). But what about experiments with other distributions?
Sampling Distributions With large enough sample size, sum/mean looks bell- shaped Normal! How many is large enough? 30 (15 if symmetric distribution) Central Limit Theorem Sum of independent variables tends towards Normal distribution http://flylib.com/books/2/528/1/html/2/images/figu115_1.jpg
Sampling Distributions With large enough sample size, sum/mean looks bell- shaped Normal! How many is large enough? 30 (15 if symmetric distribution) Central Limit Theorem Sum of independent variables tends towards Normal distribution http://flylib.com/books/2/528/1/html/2/images/figu115_1.jpg
Sampling Distributions With large enough sample size, sum/mean looks bell- shaped Normal! How many is large enough? 30 (15 if symmetric distribution) Central Limit Theorem Sum of independent variables tends towards Normal distribution http://flylib.com/books/2/528/1/html/2/images/figu115_1.jpg
Sampling Distributions With large enough sample size, sum/mean looks bell- shaped Normal! How many is large enough? 30 (15 if symmetric distribution) Central Limit Theorem Sum of independent variables tends towards Normal distribution http://flylib.com/books/2/528/1/html/2/images/figu115_1.jpg
Sampling Distributions With large enough sample size, sum/mean looks bell- shaped Normal! How many is large enough? 30 (15 if symmetric distribution) Central Limit Theorem Sum of independent variables tends towards Normal distribution http://flylib.com/books/2/528/1/html/2/images/figu115_1.jpg
Sampling Distributions With large enough sample size, sum/mean looks bell- shaped Normal! How many is large enough? 30 (15 if symmetric distribution) Central Limit Theorem Sum of independent variables tends towards Normal distribution http://flylib.com/books/2/528/1/html/2/images/figu115_1.jpg
Sampling Distributions With large enough sample size, sum/mean looks bell- shaped Normal! How many is large enough? 30 (15 if symmetric distribution) Central Limit Theorem Sum of independent variables tends towards Normal distribution http://flylib.com/books/2/528/1/html/2/images/figu115_1.jpg
Sampling Distributions With large enough sample size, sum/mean looks bell- shaped Normal! How many is large enough? 30 (15 if symmetric distribution) Central Limit Theorem Sum/mean of independent variables tends towards Normal distribution http://flylib.com/books/2/528/1/html/2/images/figu115_1.jpg
Why do we care about sample means following Normal distribution? What if we had only a sample mean and no measure of spread e.g., mean score is 3 What can we say about population mean? Not a whole lot! Yes, population mean could be 6. But could be 0. How likely are each? No idea! A A B B Sample mean Population mean?
Why do we care about sample means following Normal distribution? Remember this? http://www.six-sigma-material.com/images/PopSamples.GIF Allows us to predict range to bound population mean (see next slide) With mean and standard deviation
Why do we care about sample means following Normal distribution? Sample mean Actual population mean (probably) in this range! Probable range of population mean
Outline Overview Foundation Inferring Population Parameters Hypothesis Testing (done) (done) (next)
Estimating Population Mean Underlying data follows uniform probability distribution (d6) But assume population mean unknown (Example) Sample 1 d6 2 d6 (4 + 2) / 2 = 3 d6 (1 + 6 + 2) / 3 = 4 d6 (4 + 4 + 2 + 3) / 4 = 3.3 Sample Mean 4.0 3.0 2.3 Q: How do we estimate the population mean?
Estimating Population Mean Sample size 50 Q: What happens as sample size increases? Q: How big a sample do we need? Depends upon how much varies Values that are not the mean are an error sampling error https://demonstrations.wolfram.com/La wOfLargeNumbersDiceRollingExample/
Estimating Population Mean Sample size 50 Q: What happens as sample size increases? Q: How big a sample do we need? Depends upon how much varies Values that are not the mean contribute to error sampling error Sample size 500 Sample size 5000 https://demonstrations.wolfram.com/La wOfLargeNumbersDiceRollingExample/
Sampling Error Error from estimating population parameters from sample statistics is sampling error Exact error often cannot be known (do not know population parameters) But size of error based on: Variation in population ( ) itself more variation, more sample statistic variation (s) Sample size (N) larger sample, lower error Q: Why can t we just make sample size super large? How much does it vary? Standard error high variance low variance
Standard Error Amount sample means will vary from experiment to experiment of same size Standard deviation of the sample means Also, likelihood that sample statistic is near population parameter s What does the size of the standard error depend upon? (Hint: see formula above) So what? Reason about population mean e.g., 95% confident that sample mean is within ~ 2 SE s (where does this come from?)
Standard Error Amount sample means will vary from experiment to experiment of same size Standard deviation of the sample means Also, likelihood that sample statistic is near population parameter s Depends upon sample size (N) Depends upon standard deviation (s) So what? Reason about population mean e.g., 95% confident that sample mean is within ~ 2 SE s (where does this come from?) (Example next)
Standard Error (2 of 2) standard error, 100 experiments, N=3 If N=20: If N = 20: What will happen to means? What will happen to bars? How many will cross the blue line? What will happen to x s? What will happen to dots? Groupwork! http://www.biostathandbook.com/standarderror.html
Groupwork 1. How many of the bars intersect the blue? 2. What do graphs look like N = 20? 3. Now, how many bars intersect? Standard Error https://web.cs.wpi.edu/~imgd2905/d23/groupwork/7-std- error/handout.html standard error, 100 experiments, N=3
Standard Error (2 of 2) standard error, 100 experiments, N=3 If N=20: If N = 20: What will happen to means? What will happen to bars? How many will cross the blue line? What will happen to x s? What will happen to dots? http://www.biostathandbook.com/standarderror.html
Standard Error (2 of 2) standard error, 100 experiments, N=3 standard error, 100 experiments, N=20 How many cross the blue line? Estimate population parameter confidence interval http://www.biostathandbook.com/standarderror.html
Confidence Interval Range of values with specific certainty that population parameter is within e.g., 90% confidence interval for mean League of Legends match duration: [28.5 minutes, 32.5 minutes] Have sample of durations Compute interval containing mean population duration ( ) (with 90% confidence) In general: probability of in interval [c1,c2] with A confidence Mean: 30.5 28.5 32.5
Confidence Interval for Mean Probability of in interval [c1,c2] P(c1 < < c2) = 1- [c1, c2] is confidence interval is significance level 100(1- ) is confidence level Typically want small so confidence level 90%, 95% or 99% (more on effect later) Say, = 0.1. Could do k experiments (size n), find sample means, sort Graph distribution Interval from distribution: Lower bound: 5% Upper bound: 95% 90% confidence interval So, do we have to do k experiments, each of size n?! http://www.comfsm.fm/~dleeling/statistics/notes009_normalcurve90.png
Confidence Interval Estimate Estimate interval from 1 experiment, size n Compute sample mean ( ?), sample standard error (SE) Multiply SE by t distribution Add/subtract from sample mean Confidence interval e.g., mean 30.5 t x SE = 2 30.5 - 2 = 28.5 30.5 + 2 = 32.5 [28.5, 32.5] Ok, what is t distribution? Function, parameterized by and n
t distribution Looks like standard normal, but bit squashed Gets more less squashed as n gets larger Note, can use standard normal (z distribution) when large enough sample size (n = 30+) aka student s t distribution ( student was anonymous name used when published by William Gosset) http://ci.columbia.edu/ci/premba_test/c0331/images/s7/6317178747.gif
Computing a Confidence Interval Example (Unsorted) Game Time Suppose gathered game times in a user study (e.g., for your MQP) Can compute sample mean, yes But really want to know where population mean is Bound with confidence interval 4.4 3.8 2.8 4.2 2.8 2.9 1.9 5.9 3.9 3.2 4.1 5.3 3.6 5.1 2.7 3.9 3.9 3.2 4.1 3.3 2.8 4.2 3.1 4.5 4.5 4.8 4.9 5.1 3.7 3.4 5.6 3.1
Computing a Confidence Interval Example (Sorted) Game Time A 90% confidence interval ( is 0.1) for population mean ( ): 3.90 1.696 0.95 32 = [3.62, 4.19] ? = 3.90, stddev s=0.95, n=32 1.9 2.7 2.8 2.8 2.8 2.9 3.1 3.1 3.2 3.2 3.3 3.4 3.6 3.7 3.8 3.9 3.9 3.9 4.1 4.1 4.2 4.2 4.4 4.5 4.5 4.8 4.9 5.1 5.1 5.3 5.6 5.9 Need t =TINV(0.1,31) 1.696 With 90% confidence, in that interval. Chance of error 10%. But, what does that mean? (See next slide for depiction of meaning)
Meaning of Confidence Interval () If 100 experiments and confidence level is 90%: 90 cases interval includes , in 10 cases not include f(x) Includes ? yes yes no yes yes > 100 (1- ) 90 no < 100 Experiment/Sample 1 2 3 100 Total Total =0.1 e.g., 10
How does Confidence Interval Size Change? With sample size (N) With confidence level (1- ) Look at each separately next
How does Confidence Interval Change (1 of 2)? What happens to confidence interval when sample size (N) increases? Hint: think about Standard Error
How does Confidence Interval Change (1 of 2)? What happens to confidence interval when sample size (N) increases? Hint: think about Standard Error
How does Confidence Interval Change (2 of 2)? What happens to confidence interval when confidence level (1- )increases? 90% CI = [6.5, 9.4] 90% chance population value is between 6.5, 9.4 95% CI = [6.1, 9.8] 95% chance population value is between 6.1, 9.8 Why is interval wider when we are more confident? http://vassarstats.net/textbook/f1002.gif
How does Confidence Interval Change (2 of 2)? What happens to confidence interval when confidence level (1- )increases? 90% CI = [6.5, 9.4] 90% chance population value is between 6.5, 9.4 95% CI = [6.1, 9.8] 95% chance population value is between 6.1, 9.8 Why is interval wider when we are more confident? See distribution on the right http://vassarstats.net/textbook/f1002.gif
Groupwork Interpreting a Confidence Interval https://web.cs.wpi.edu/~imgd2905/d23/groupwork /9-conf-interp/handout.html
Using Confidence Interval (1 of 3) For charts, depict with error bars CI different than standard deviation Standard deviation show spread CI bounds population parameter (decreases with N) CI indicates range of population parameter Make sure sample size N=30+ (N=15+ if somewhat normal. Any N if know distro is normal)
Using Confidence Interval (2 of 3) https://measuringu.com/ci-10things/ No overlap Large overlap Some overlap Compare two alternatives, quick check for statistical significance No overlap? 90% confident difference (at = 0.10 level) Large overlap (50%+)? No statistically significant diff (at = 0.10 level) Some overlap? more tests required
Using Confidence Interval (3 of 3) [Some Overlap] (Some overlap) (Here is the overlap) But if compute difference, and then confidence interval does not cross 0! (Caused by error propagation)


")
")
")
")
")
")
")
")


")

")
")


")


")
")
")