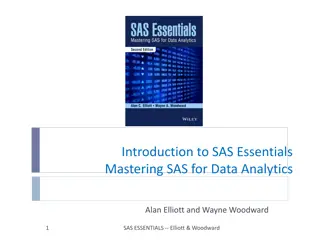
Mastering Advanced R with Tidyverse for Efficient Data Analysis
Unlock the power of Advanced R with Tidyverse through in-depth exploration of functions, operators, data manipulation, and efficient coding techniques. Dive into Tidyverse packages like tibble, readr, and dplyr to streamline data storage, reading, and manipulation. Learn to work with RStudio Projects for organized workflow management and effective version control. Import data seamlessly and handle column specifications effortlessly using readr functions. Elevate your data analysis skills to tackle real-world challenges with confidence.

Download Presentation

Please find below an Image/Link to download the presentation.
The content on the website is provided AS IS for your information and personal use only. It may not be sold, licensed, or shared on other websites without obtaining consent from the author. Download presentation by click this link. If you encounter any issues during the download, it is possible that the publisher has removed the file from their server.
E N D
Presentation Transcript
Advanced R (with Tidyverse) Simon Andrews, Laura Biggins V2024-04
Course Content Expanding knowledge More functions and operators Tidyverse operations Data Import Filtering, selecting and sorting Restructuring data Grouping and Summarising Extending and Merging Improving efficiency More options for elegant code Awkward cases Dealing with real data Custom functions
RStudio Projects Associated with a working directory Keep workspace, history, source documents in one location Avoids the need for setwd() commands Works with version control (git or subversion) https://support.posit.co/hc/en-us/articles/200526207-Using-RStudio-Projects
Tidyverse Packages tibble - data storage readR - reading data from files tidyR - Model data correctly dplyR - Manipulate and filter data ggplot2 - Draw figures and graphs
Reading Files with readr Tidyverse functions for reading text files into tibbles read_delim("file.txt") read_csv("file.csv") read_tsv("file.tsv") read_fwf("file.txt",col_positions=c(1,3,6)) read_excel("file.xlsx", sheet="Sheet1") The read_excel function isn't in core tidyverse. You need to install the readxl package to get it
Reading files with readr > trumpton <- read_delim("trumpton.txt") Rows: 7 Columns: 5 -- Column specification ------------------------------ Delimiter: "\t" chr (2): LastName, FirstName dbl (3): Age, Weight, Height i Use `spec()` to retrieve the full column specification for this data. i Specify the column types or set `show_col_types = FALSE` to quiet this message. > trumpton # A tibble: 7 x 5 LastName FirstName Age Weight Height <chr> <chr> <dbl> <dbl> <dbl> 1 Hugh Chris 26 90 175 2 Pew Adam 32 102 183
Reading files with readr chr (2): LastName, FirstName dbl (3): Age, Weight, Height > spec(trumpton) cols( LastName = col_character(), FirstName = col_character(), Age = col_double(), Weight = col_double(), Height = col_double() )
Import Problems > problem_data <- read_delim("import_problems.txt") Rows: 1042 Columns: 4 -- Column specification ------------------------------------------------- Delimiter: "\t" chr (2): Gene, Significance dbl (2): Chr, Expression Use `spec()` to retrieve the full column specification for this data. Specify the column types or set `show_col_types = FALSE` to quiet this message. Warning message: One or more parsing issues, call `problems()` on your data frame for details, e.g.: dat <- vroom(...) problems(dat) > head(problem_data) # A tibble: 6 4 Chr Gene <dbl> <chr> <dbl> 1 1 Depdc2 9.19 2 1 Sulf1 3 1 Rpl7 Expression Significance <chr> NS 9.66 NS 8.75 0.050626416
Import Problems > problems(problem_data) # A tibble: 1 x 5 row col expected actual file <int> <int> <chr> <chr> <chr> 1 1042 1 a double Y import_problems.txt Data not matching the guessed type Wrong number of fields
Fixing guessed columns # A tibble: 1,174 x 4 Chr Gene Expression Significance < <dbl dbl> > <chr> <dbl> < <chr 1 1 Depdc2 9.19 NS 2 1 Sulf1 9.66 NS 3 1 Rpl7 8.75 0.050626416 4 1 Phf3 8.43 NS 5 1 Khdrbs2 8.94 NS 6 1 Prim2 9.64 NS 7 1 Hs6st1 9.60 0.03441748 8 1 BC050210 8.74 NS 9 1 Tmem131 8.99 NS 10 1 Aff3 10.8 NS chr> > Chr should be character Significance should be numeric
Fixing guessed columns read_delim( "import_problems.txt", col_types=cols(Chr=col_character(), Significance=col_double()) ) One or more parsing issues, see `problems()` for details One or more parsing issues, see `problems()` for details > problems() # A tibble: 874 x 5 row col expected actual file <int> <int> <chr> <chr> <chr> 1 2 4 a double NS import_problems.txt 2 3 4 a double NS import_problems.txt 3 5 4 a double NS import_problems.txt 4 6 4 a double NS import_problems.txt 5 7 4 a double NS import_problems.txt 6 9 4 a double NS import_problems.txt 7 10 4 a double NS import_problems.txt 8 11 4 a double NS import_problems.txt 9 13 4 a double NS import_problems.txt 10 14 4 a double NS import_problems.txt # ... with 864 more rows # A tibble: 1,174 x 4 Chr Gene Expression Significance <chr> <chr> <dbl> <dbl> 1 1 Depdc2 9.19 NA 2 1 Sulf1 9.66 NA 3 1 Rpl7 8.75 0.0506 4 1 Phf3 8.43 NA 5 1 Khdrbs2 8.94 NA 6 1 Prim2 9.64 NA 7 1 Hs6st1 9.60 0.0344 8 1 BC050210 8.74 NA 9 1 Tmem131 8.99 NA 10 1 Aff3 10.8 NA # ... with 1,164 more rows
Unwanted header lines # Format version 1.0 # Created 20/05/2020 Gene,Strand,Group_A,Group_B,Group_C ABC1,+,5.30,4.69,4.84 DEF1,-,14.97,15.66,15.92 HIJ1,-,2.17,3.14,1.94 read_delim("unwanted_headers.txt") Error: Could not guess the delimiter. read_csv("unwanted_headers.txt") Delimiter: "," chr (1): # Format version 1.0 > problems() # A tibble: 4 x 5 row col expected actual file <int> <int> <chr> <chr> <chr> 1 3 5 1 columns 5 columns unwanted_headers.txt 2 4 5 1 columns 5 columns unwanted_headers.txt 3 5 5 1 columns 5 columns unwanted_headers.txt 4 6 5 1 columns 5 columns unwanted_headers.txt # A tibble: 5 x 1 `# Format version 1.0` <chr> 1 # Created 20/05/2020 2 Gene 3 ABC1 4 DEF1 5 HIJ1
Unwanted header lines # Format version 1.0 # Created 20/05/2020 Gene,Strand,Group_A,Group_B,Group_C ABC1,+,5.30,4.69,4.84 DEF1,-,14.97,15.66,15.92 HIJ1,-,2.17,3.14,1.94 read_delim( "unwanted_headers.txt", lazy=FALSE, skip=2 ) read_delim( "unwanted_headers.txt", lazy=FALSE, comment="#" ) # A tibble: 3 x 5 Gene Strand Group_A Group_B Group_C <chr> <chr> <dbl> <dbl> <dbl> 1 ABC1 + 5.3 4.69 4.84 2 DEF1 - 15.0 15.7 15.9 3 HIJ1 - 2.17 3.14 1.94 chr (2): Gene, Strand dbl (3): Group_A, Group_B, Group_C
Exercise 1 Reading Data into Tibbles
Subsetting and Filtering select pick columns by name/position filter pick rows based on the data slice pick rows by position arrange sort rows distinct deduplicate rows
Trumpton # A tibble: 7 x 5 LastName FirstName Age Weight Height <chr> <chr> <dbl> <dbl> <dbl> 1 Hugh Chris 26 90 175 2 Pew Adam 32 102 183 3 Barney Daniel 18 88 168 4 McGrew Chris 48 97 155 5 Cuthbert Carl 28 91 188 6 Dibble Liam 35 94 145 7 Grub Doug 31 89 164
Using select or slice select(data,cols) slice(data,rows) trumpton %>% select(LastName,Age,Height) trumpton %>% slice(1,4,7) # A tibble: 7 x 3 LastName Age Height <chr> <dbl> <dbl> 1 Hugh 26 175 2 Pew 32 183 3 Barney 18 168 4 McGrew 48 155 5 Cuthbert 28 188 6 Dibble 35 145 7 Grub 31 164 # A tibble: 3 x 5 LastName FirstName Age Weight Height <chr> <chr> <dbl> <dbl> <dbl> 1 Hugh Chris 26 90 175 2 McGrew Chris 48 97 155 3 Grub Doug 31 89 164
Using select and slice trumpton %>% select(LastName, Age, Height) %>% slice(1,4,7) # A tibble: 3 x 3 LastName Age Height <chr> <dbl> <dbl> 1 Hugh 26 175 2 McGrew 48 155 3 Grub 31 164
Functional row selection using filter trumpton %>% filter(Height>170) # A tibble: 3 x 5 LastName FirstName Age Weight Height <chr> <chr> <dbl> <dbl> <dbl> 1 Hugh Chris 26 90 175 2 Pew Adam 32 102 183 3 Cuthbert Carl 28 91 188
Defining Selected Columns Single definitions (name, position or function) Positive weight, height, length, 1, 2, 3, last_col(), everything() Negative -chromosome, -start, -end, -1, -2, -3 Range selections 3:5 -(3:5) height:length -(height:length) Functional selections (positive or negative) starts_with() ends_with() contains() matches() -starts_with() -ends_with() -contains() -matches()
Using select helpers colnames(child.variants) CHR POS dbSNP REF ALT QUAL GENE ENST MutantReads COVERAGE MutantReadPercent child.variants %>% select(REF,COVERAGE REF,COVERAGE) REF COVERAGE select(REF,everything REF,everything() ()) REFCHR POS dbSNP ALT QUAL GENE ENST MutantReads COVERAGE MutantReadPercent select(- -CHR, CHR, - -ENST ENST) POS dbSNP REF ALT QUAL GENE MutantReads COVERAGE MutantReadPercent select(-REF,everything REF,everything() ()) CHR POS dbSNP ALT QUAL GENE ENST MutantReads COVERAGE MutantReadPercent REF select(5:last_col() 5:last_col()) ALT QUAL GENE ENST MutantReads COVERAGE MutantReadPercent select(POS:GENE POS:GENE) POS dbSNP REF ALT QUAL GENE select(- -(POS:GENE) (POS:GENE)) CHR ENST MutantReads COVERAGE MutantReadPercent select(starts_with starts_with(" ("Mut Mut") ")) MutantReads MutantReadPercent select(- -ends_with ends_with("t", select(contains("Read") contains("Read")) ("t",ignore.case ignore.case = FALSE) = FALSE)) CHR POS dbSNP REF ALT QUAL GENE ENST MutantReads COVERAGE MutantReads MutantReadPercent
arrange (sorting) distinct (deduplication) trumpton %>% arrange(Height) %>% distinct(FirstName, .keep_all = TRUE) # A tibble: 6 x 5 LastName FirstName Age Weight Height <chr> <chr> <dbl> <dbl> <dbl> 1 Dibble Liam 35 94 145 2 McGrew Chris McGrew Chris 48 97 155 3 Grub Doug 31 89 164 4 Barney Daniel 18 88 168 5 Pew Adam 32 102 183 6 Cuthbert Carl 28 91 188 You need . .keep_all =TRUEif you want to see more than the distinct column. keep_all has a dot before it keep_all=TRUE
arrange (sorting) distinct (deduplication) trumpton %>% arrange(desc(Height)) %>% distinct(FirstName, .keep_all = TRUE) # A tibble: 6 x 5 LastName FirstName Age Weight Height <chr> <chr> <dbl> <dbl> <dbl> 1 Cuthbert Carl 28 91 188 2 Pew Adam 32 102 183 3 Hugh Chris Hugh Chris 26 90 175 4 Barney Daniel 18 88 168 5 Grub Doug 31 89 164 6 Dibble Liam 35 94 145
Exercise 2 Filtering and selecting
Multi-condition filter trumpton %>% filter(Height > 170) %>% filter(Age > 30) # A tibble: 1 x 5 LastName FirstName Age Weight Height <chr> <chr> <dbl> <dbl> <dbl> 1 Pew Adam 32 102 183
Multi-condition filter trumpton %>% filter(Height > 170 & Age > 30) & | ! = logical NOT = logical AND = logical OR # A tibble: 1 x 5 LastName FirstName Age Weight Height <chr> <chr> <dbl> <dbl> <dbl> 1 Pew Adam 32 102 183
Multi-condition filter trumpton %>% filter(Height > 170 | Age > 30) & | ! = logical NOT = logical AND = logical OR # A tibble: 6 x 5 LastName FirstName Age Weight Height <chr> <chr> <dbl> <dbl> <dbl> 1 Hugh Chris 26 90 175 2 Pew Adam 32 102 183 3 McGrew Chris 48 97 155 4 Cuthbert Carl 28 91 188 5 Dibble Liam 35 94 145 6 Grub Doug 31 89 164
Multi-condition filter trumpton %>% filter(!(Height > 170 | Age > 30)) & | ! = logical NOT = logical AND = logical OR # A tibble: 1 x 5 LastName FirstName Age Weight Height <chr> <chr> <dbl> <dbl> <dbl> 1 Barney Daniel 18 88 168
Using filter with %in% > hits [1] "FGFR1" "RASAL1" "GLB1L2" "DNAH1" "PTH1R" child.variants %>% filter(GENE %in% %in% hits) # A tibble: 5 x 11 CHR POS dbSNP REF ALT QUAL GENE ENST MutantReads COVERAGE MutantReadPerce~ <chr> <dbl> <chr> <chr> <chr> <dbl> <chr> <chr> <dbl> <dbl> <dbl> 1 11 134226278 rs3802928 C T 200 GLB1L2 ENST03898~ 13 43 30 2 12 113539822 rs1674101 A G 200 RASAL1 ENST05465~ 19 22 86 3 3 46944274 rs1138518 T C 200 PTH1R ENST04495~ 32 75 42 4 3 52430526 rs12163565 G A 200 DNAH1 ENST04203~ 38 50 76 5 8 38271182 . TG T 200 FGFR1 ENST04259~ 9 31 29
Using filter with str_detect child.variants %>% filter(str_detect str_detect(GENE,"ZFP")) # A tibble: 9 x 11 CHR POS dbSNP REF ALT QUAL GENE ENST MutantReads COVERAGE MutantReadPerce~ <chr> <dbl> <chr> <chr> <chr> <dbl> <chr> <chr> <dbl> <dbl> <dbl> 1 16 68598007 rs1177648 A G 200 ZFP90 ENST0398253 43 100 43 2 16 88552370 rs3751673 A G 53 ZFPM1 ENST0319555 4 23 17 3 18 5292030 rs620652 A G 200 ZFP161 ENST0357006 28 71 39 4 19 57065189 rs145011 T C 200 ZFP28 ENST0301318 59 137 43 5 20 50768672 . GT G 200 ZFP64 ENST0216923 36 41 87 6 5 180276402 rs168726 C T 200 ZFP62 ENST0502412 74 83 89 7 8 106814656 rs2920048 G C 200 ZFPM2 ENST0407775 33 79 41 8 8 144332012 rs6558339 T C 200 ZFP41 ENST0330701 32 37 86 9 9 115818949 rs2282076 A T 200 ZFP37 ENST0374227 18 43 41
Using filter with str_detect child.variants %>% filter(str_detect(GENE,"Z.P")) # A tibble: 15 x 11 CHR POS dbSNP REF ALT QUAL GENE ENST MutantReads COVERAGE MutantReadPercent <chr> <dbl> <chr> <chr> <chr> <dbl> <chr> <chr> <dbl> <dbl> <dbl> 1 7 99569394 rs17295356 G A 200 AZGP1 ENST0292401 9 34 26 2 12 51636259 rs1049467 C T 200 DAZAP2 ENST0549555 62 68 91 3 3 137786442 rs442800 T C 200 DZIP1L ENST0327532 9 32 28 4 3 108403086 rs9856097 T C 200 DZIP3 ENST0361582 26 30 86 5 20 56179586 rs6123710 G A 200 ZBP1 ENST0371173 15 44 34 6 18 5292030 rs620652 A G 200 ZFP161 ENST0357006 28 71 39 7 19 57065189 rs145011 T C 200 ZFP28 ENST0301318 59 137 43 8 9 115818949 rs2282076 A T 200 ZFP37 ENST0374227 18 43 41
Using filter with other string operations child %>% select(REF,ALT) %>% filter(startsWith startsWith(REF,"GAT")) child %>% select(GENE,ENST) %>% filter(endsWith endsWith(ENST,"878")) # A tibble: 3 x 2 REF ALT <chr> <chr> 1 GATA G 2 GATAT GAT 3 GAT G # A tibble: 4 x 2 GENE ENST <chr> <chr> 1 CIB3 ENST0269878 2 KCTD18 ENST0359878 3 KIAA1407 ENST0295878 4 RBM33 ENST0401878 These are different to the select helpers starts_with and ends_with which are used for picking columns
Using filter with is functions > data.with.na # A tibble: 8 x 2 sample value <chr> <dbl> 1 A 9.98 2 A 8.58 3 A 10.4 4 A 11.4 5 B 9.75 6 B 11.2 7 B NA 8 B NA data.with.na %>% filter(!is.na(value)) is_finite is_infinite is.nan # A tibble: 6 x 2 sample value <chr> <dbl> 1 A 9.98 2 A 8.58 3 A 10.4 4 A 11.4 5 B 9.75 6 B 11.2 NA NA Note that some functions have dots whilst others have an underscore.
Transforming data in a filter trumpton %>% filter(log log(Height)>5) log abs sqrt nchar substr tolower toupper etc. # A tibble: 6 x 5 LastName FirstName Age Weight Height <chr> <chr> <dbl> <dbl> <dbl> 1 Hugh Chris 26 90 175 2 Pew Adam 32 102 183 3 Barney Daniel 18 88 168 4 McGrew Chris 48 97 155 5 Cuthbert Carl 28 91 188 6 Grub Doug 31 89 164
Transforming filter examples trumpton %>% filter(str_detect(tolower(LastName),"h")) log abs nchar str_sub tolower toupper etc. trumpton %>% filter(Weight*0.16 > 15) trumpton %>% filter(nchar(LastName) == nchar(FirstName))
Exercise 3 More clever filtering
'Tidy' Data Format Tibbles give you a 2D data structure where each column must be of a fixed data type Often data can be put into this sort of structure in more than one way Is there a right / wrong way to structure your data? Tidyverse has an opinion!
Wide Format Gene ABC1 DEF1 WT_1 8.86 29.60 WT_2 4.18 41.22 WT_3 8.90 36.15 KO_1 4.00 11.18 KO_2 14.52 16.68 KO_3 13.39 1.64 Compact Easy to read Shows linkage for genes No explicit genotype or replicate Values spread out over multiple rows and columns Not extensible to more metadata
Long Format Gene ABC1 ABC1 ABC1 ABC1 ABC1 ABC1 DEF1 DEF1 DEF1 DEF1 DEF1 DEF1 Genotype WT WT WT KO KO KO WT WT WT KO KO KO Replicate 1 2 3 1 2 3 1 2 3 1 2 3 Value 8.86 4.18 8.90 4.00 14.52 13.39 29.60 41.22 36.15 11.18 16.68 1.64 More verbose (repeated values) Explicit genotype and replicate All values in a single column Extensible to more metadata
Converting to "Tidy" format # A tibble: 3 x 8 Gene Chr Start End WT_1 WT_2 KO_1 KO_2 <chr> <dbl> <dbl> <dbl> <dbl> <dbl> <dbl> <dbl> 1 Gnai3 2 163898 167465 9.39 10.9 33.5 81.9 2 Pbsn 5 4888573 4891351 91.7 59.6 45.3 82.3 3 Cdc45 7 1250084 1262669 69.2 36.1 54.4 38.1 Put all measures into a single column Add a 'genotype' and 'replicate' column Duplicate the gene information as required Or separate it into a different table
Converting to "Tidy" format # A tibble: 3 x 8 Gene Chr Start End WT_1 WT_2 KO_1 KO_2 <chr> <dbl> <dbl> <dbl> <dbl> <dbl> <dbl> <dbl> 1 Gnai3 2 163898 167465 9.39 10.9 33.5 81.9 2 Pbsn 5 4888573 4891351 91.7 59.6 45.3 82.3 3 Cdc45 7 1250084 1262669 69.2 36.1 54.4 38.1 non.normalised %>% pivot_longer(cols=WT_1:KO_2, names_to="sample", values_to="value") %>% separate(sample,into=c("genotype","replicate"),convert = TRUE,sep="_")
Converting to "Tidy" format # A tibble: 12 x 7 Gene Chr Start End genotype replicate value <chr> <dbl> <dbl> <dbl> <chr> <int> <dbl> 1 Gnai3 2 163898 167465 WT 1 9.39 2 Pbsn 5 4888573 4891351 WT 1 91.7 3 Cdc45 7 1250084 1262669 WT 1 69.2 4 Gnai3 2 163898 167465 WT 2 10.9 5 Pbsn 5 4888573 4891351 WT 2 59.6 6 Cdc45 7 1250084 1262669 WT 2 36.1 7 Gnai3 2 163898 167465 KO 1 33.5 8 Pbsn 5 4888573 4891351 KO 1 45.3 9 Cdc45 7 1250084 1262669 KO 1 54.4 10 Gnai3 2 163898 167465 KO 2 81.9 11 Pbsn 5 4888573 4891351 KO 2 82.3 12 Cdc45 7 1250084 1262669 KO 2 38.1
Tidying operations pivot_longer Takes multiple columns of the same type and puts them into a pair of key-value columns separate Splits a delimited column into multiple columns Wide to Long A B C A A A B B B C C C WT_D1 WT D1 Long to Wide pivot_wider Takes a key-value column pair and spreads them out to multiple columns of the same type unite Combines multiple columns into one A B C A A A B B B C C C WT D1 WT_D1
Converting to "Tidy" format # A tibble: 3 x 8 Gene Chr Start End WT_1 WT_2 KO_1 KO_2 <chr> <dbl> <dbl> <dbl> <dbl> <dbl> <dbl> <dbl> 1 Gnai3 2 163898 167465 9.39 10.9 33.5 81.9 2 Pbsn 5 4888573 4891351 91.7 59.6 45.3 82.3 3 Cdc45 7 1250084 1262669 69.2 36.1 54.4 38.1 non.normalised %>% pivot_longer( cols=WT_1:KO_2, names_to="sample", values_to="value" ) %>% separate( col=sample, into=c("genotype","replicate"), sep="_", convert = TRUE ) convert=TRUE convert=TRUE makes separate re-detect the type of the column, so replicate becomes a numeric value
> pivot.data # A tibble: 4 x 3 gene WT KO <chr> <dbl> <dbl> 1 ABC1 18608 7831 2 DEF1 31988 55502 3 GHI1 7647 93299 4 JKL1 96002 47945 Pivoting Examples pivot.data %>% pivot_longer( cols=WT:KO, names_to = "Condition", values_to = "Count" ) -> pivot.long Log transform all of the values Pivot longer Which columns are we pivoting? What do we want to call the new column of names? What do we want to call the new column of values? # A tibble: 8 x 3 gene Condition Count <chr> <chr> <dbl> 1 ABC1 WT 18608 2 ABC1 KO 7831 3 DEF1 WT 31988 4 DEF1 KO 55502 5 GHI1 WT 7647 6 GHI1 KO 93299 7 JKL1 WT 96002 8 JKL1 KO 47945
> pivot.long # A tibble: 8 x 3 gene Condition Count <chr> <chr> <dbl> 1 ABC1 WT 14.2 2 ABC1 KO 12.9 3 DEF1 WT 15.0 4 DEF1 KO 15.8 5 GHI1 WT 12.9 6 GHI1 KO 16.5 7 JKL1 WT 16.6 8 JKL1 KO 15.5 Pivoting Examples pivot.long %>% pivot_wider( names_from = Condition, values_from = Count ) # A tibble: 4 x 3 gene WT KO <chr> <dbl> <dbl> 1 ABC1 14.2 12.9 2 DEF1 15.0 15.8 3 GHI1 12.9 16.5 4 JKL1 16.6 15.5 Plot WT vs KO Pivot wider Which column of names? Which column of values?
Splitting into multiple tibbles Where you have a lot of annotation, you can split this into a separate tibble to reduce the amount of data duplication # A tibble: 3 x 8 Gene Chr Start End WT_1 WT_2 KO_1 KO_2 <chr> <dbl> <dbl> <dbl> <dbl> <dbl> <dbl> <dbl> 1 Gnai3 2 163898 167465 9.39 10.9 33.5 81.9 2 Pbsn 5 4888573 4891351 91.7 59.6 45.3 82.3 3 Cdc45 7 1250084 1262669 69.2 36.1 54.4 38.1


")
")