NCI Data Collections BARPA & BARRA2 Overview
NCI Data Collections BARPA & BARRA2 serve as critical enablers of big data science and analytics in Australia, offering a vast research collection of climate, weather, earth systems, environmental, satellite, and geophysics data. These collections include around 8PB of regional climate simulations a
6 views • 22 slides
Ask On Data for Efficient Data Wrangling in Data Engineering
In today's data-driven world, organizations rely on robust data engineering pipelines to collect, process, and analyze vast amounts of data efficiently. At the heart of these pipelines lies data wrangling, a critical process that involves cleaning, transforming, and preparing raw data for analysis.
2 views • 2 slides
Data Wrangling like Ask On Data Provides Accurate and Reliable Business Intelligence
In current data world, businesses thrive on their ability to harness and interpret vast amounts of data. This data, however, often comes in raw, unstructured forms, riddled with inconsistencies and errors. To transform this chaotic data into meaningful insights, organizations need robust data wrangl
0 views • 2 slides
The Key to Accurate and Reliable Business Intelligence Data Wrangling
Data wrangling is the cornerstone of effective business intelligence. Without clean, accurate, and well-organized data, the insights derived from analysis can be misleading or incomplete. Ask On Data provides a comprehensive solution to the challenges of data wrangling, empowering businesses to tran
0 views • 2 slides
Beginner's Guide to Twitter: Join, Tweet, and Connect on the Popular Social Network
Twitter is a social networking and micro-blogging platform where users share thoughts, news, and information in 140 characters or less. Learn how to join, tweet, and interact with others using terms like "tweet," "retweet," "feed," "handle," "mention," "direct message," and "hashtag." Customize your
1 views • 14 slides
The Bird Is The Word: A Comprehensive Twitter Tutorial
An in-depth guide to navigating the world of Twitter, covering topics such as Twitter lingo, interacting with others, hashtags, and privacy settings. Learn about tweets, feeds, handles, mentions, direct messaging, and more. Discover the ins and outs of using this online social network to communicate
0 views • 18 slides
Enhancing Twitter Engagement: Recommendations for Orphaned Tweets
Twitter users often face challenges with orphaned tweets lacking hashtags, impacting visibility and engagement. Manikandan Vijayakumar's thesis explores leveraging social signals to recommend hashtags, highlighting the significance of hashtags in organizing tweets, enhancing discoverability, and inc
1 views • 71 slides
Enhancing Learning with Twitter: Strategies for Better Engagement
Explore innovative ways to leverage Twitter for education, presented by Dr. Rebekah Fitzsimmons. Discover techniques like livetweeting for note-taking, peer feedback through social media, and the pedagogical implications of using multimodality in teaching. Uncover the power of hashtags to build comm
1 views • 21 slides
Twitter Poster Conference - Creating an Impactful Presentation
Join us at the Twitter Poster Conference on 15th and 16th July 2020 to learn the guidelines for creating engaging and informative scientific posters. From background motivation to results and conclusions, discover how to effectively showcase your research!
0 views • 10 slides
Guidelines for Creating an Impactful Twitter Poster Presentation
Elevate your presentation at the Twitter Poster Conference #IOPPposter on 14-15 July 2021 by following these guidelines: Add your subject category hashtags, provide background information on your research, explain your methods and techniques, and showcase your results and conclusions with proposals
0 views • 11 slides
Bioinformatics for Genomics Lecture Series 2022 Overview
Delve into the Genetics and Genome Evolution (GGE) Bioinformatics for Genomics Lecture Series 2022 presented by Sven Bergmann. Explore topics like RNA-seq, differential expression analysis, clustering, gene expression data analysis, epigenetic data analysis, integrative analysis, CHIP-seq, HiC data,
0 views • 36 slides
Understanding Exploratory Data Analysis (EDA) for Effective Data Insights
Exploratory Data Analysis (EDA) is a crucial approach for analyzing data by utilizing various techniques to extract insights, identify anomalies, and visualize trends. By leveraging EDA using tools like Pandas, researchers can improve their understanding of data variables, detect errors, and explore
1 views • 14 slides
Qualitative Data Analysis Techniques in Research
The purpose of data analysis is to organize, structure, and derive meaning from research data. Qualitative analysis involves insight, creativity, and hard work. Researchers play a crucial role as instruments for data analysis, exploring and reflecting on interview discussions. Steps include transcri
1 views • 27 slides
Interactive Hololens Tour Project Overview
This project involves creating a Microsoft Hololens heads-up display for an interactive tour of the ASU campus. It includes showcasing landmarks and a Twitter feed displaying geo-tagged tweets. The motivation stems from enhancing self-guided tour experiences for prospective students, potentially aid
1 views • 15 slides
Understanding Data Governance and Data Analytics in Information Management
Data Governance and Data Analytics play crucial roles in transforming data into knowledge and insights for generating positive impacts on various operational systems. They help bring together disparate datasets to glean valuable insights and wisdom to drive informed decision-making. Managing data ma
0 views • 8 slides
Workshop on Data Analysis in Business and Law at University of Nigeria, Nsukka
This workshop at the University of Nigeria, Nsukka focuses on data analysis in business and law, covering topics such as measurement, scaling, data preparation, analysis, and interpretation. Participants will learn about the importance of data integrity, statistical tools, and the benefits of ICT in
4 views • 21 slides
Exploratory Data Analysis and Descriptive Statistics in Statistical Analysis
Exploratory Data Analysis involves understanding data characteristics through visualization techniques like bar graphs, pie charts for qualitative data and histograms, scatterplots for quantitative data. It includes calculating mean, median for center, range, standard deviation for spread, and ident
0 views • 7 slides
Understanding Data Analysis in Nursing Research
Data analysis in nursing research involves rendering individual data points into meaningful information, leading to knowledge generation. The process includes qualitative and quantitative analysis to organize and interpret data effectively. Techniques such as data reduction, data display, and conclu
2 views • 26 slides
Importance of Data Preparation in Data Mining
Data preparation, also known as data pre-processing, is a crucial step in the data mining process. It involves transforming raw data into a clean, structured format that is optimal for analysis. Proper data preparation ensures that the data is accurate, complete, and free of errors, allowing mining
1 views • 37 slides
Leveraging Arabic Twitter for COVID-19 Insights
Governments and Public Health Organizations can harness the power of Arabic Twitter to extract valuable insights during the COVID-19 pandemic. By analyzing Arabic tweets, they can uncover topics of discussion, identify rumors, predict tweet sources, and update disease ontologies. Data collection spa
0 views • 20 slides
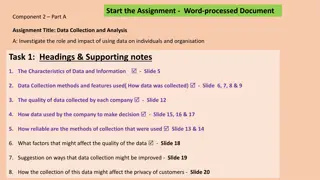
Understanding Data Collection and Analysis for Businesses
Explore the impact and role of data utilization in organizations through the investigation of data collection methods, data quality, decision-making processes, reliability of collection methods, factors affecting data quality, and privacy considerations. Two scenarios are presented: data collection
1 views • 24 slides
Analysis of Spam Activity on Popular Social Networks
This research paper presents an in-depth analysis of spam activity on major social networking platforms such as Facebook, MySpace, and Twitter. The study includes data collection, analysis of spam bots, identification of spam campaigns, and analysis of results. It reveals insights into user behavior
2 views • 38 slides
Data Analysis and Passage Analysis Project Proposal
This project proposal by Anthony Yang focuses on developing a Java program for data analysis and passage analysis. The motivation behind the project is to gain more knowledge in computer science and statistics-related topics while utilizing technology to extract useful insights from data. The propos
0 views • 8 slides
Using Google Data to Measure Cross-National Religious Differences
Exploring how Google data can provide insights into religious differences across nations, this research investigates the limitations of traditional survey methods and the potential of social media for social science research. By leveraging Google and Twitter data, researchers can access geocoded inf
1 views • 33 slides
Understanding Least Squares Estimation in Global Warming Data Analysis
Exploring least squares estimation in the context of global warming data analysis, this content illustrates the process of fitting a curve to observed data points using a simple form of data analysis. It discusses noisy observed data, assumptions, errors, and the importance of model parameters in ma
0 views • 38 slides
Decoding Sarcasm in Tweets: A Comprehensive Analysis
This research delves into the realm of sarcasm detection in tweets, utilizing a dataset of sarcastic and non-sarcastic tweets to build a model for classification. Through methods like feature extraction and model building with WEKA, the study aims to enhance the understanding of sarcasm detection on
0 views • 9 slides
Analyzing Qualitative Data: Steps and Coding Methods
Understanding qualitative data analysis involves several key steps, such as preparing the data through transcription, developing codes and categories using content analysis, revising categories based on the data, and reporting the analysis results. Content analysis helps in identifying words, themes
0 views • 32 slides
Big Data and Ethical Considerations in Data Analysis
Big data involves analyzing and extracting information from large and complex datasets that traditional software cannot handle. AI algorithms play a crucial role in processing big data to find patterns that humans may overlook. Ethical considerations arise in defining what is "interesting" in the da
0 views • 25 slides
Introduction to IBM SPSS Modeler: Association Analysis and Market Basket Analysis
Understanding Association Analysis in IBM SPSS Modeler 14.2, also known as Affinity Analysis or Market Basket Analysis. Learn about identifying patterns in data without specific targets, exploring data mining in an unsupervised manner. Discover the uses of Association Rules, including insights into
0 views • 18 slides
Explore Twitter Data Analysis Project - Discovering Trends and Insights
The Social Media Data Analysis Team led by Hanu Pathuri and Mohammed Tawashi is focused on conducting exploratory analysis of Twitter data with media. By analyzing the vast amount of data available on Twitter, the team aims to uncover interesting facts, trends, and patterns. They are investigating h
0 views • 47 slides
Analyzing Information Spread on Twitter for Improved Content Distribution
This study by Amit Ruhela explores the spread of information on Twitter and its implications for internet content distribution. It discusses the rapid growth in online social networking usage, the utilization of OSN websites for content distribution, and the goal of enhancing web CDN caching algorit
0 views • 31 slides
Implementing Turkish Sentiment Analysis on Twitter Data Using Semi-Supervised Learning
This project involved gathering a substantial amount of Twitter data for sentiment analysis, including 1717 negative and 687 positive tweets. The data labeling process was initially manual but later automated using a semi-supervised learning technique. A Naive Bayes Classifier was trained using a Ba
0 views • 17 slides
Evaluating Microblog Content: Who Gives a Tweet?
This study delves into the evaluation of microblog content value by analyzing feedback from followers and strangers on Twitter. The research explores the content that is valued and why, examining design implications, emerging norms, and practices in the online space. The study also discusses anticip
0 views • 44 slides
Mining Twitter Data for Fun and Profit
This presentation discusses the analysis of Twitter feed data related to various topics such as surgical providers, surgical education, global surgery, breast cancer, and mammography. It explores the content, users, and re-tweet patterns, along with a desire for an automated process to extract user
0 views • 27 slides
Scaling Big Data Mining Infrastructure: The Twitter Experience
The paper explores the challenges faced by Twitter in scaling its analytics infrastructure to handle massive amounts of data. It discusses the importance of schemas, data cleaning, and formulating precise analytical questions. Methods used for logging and structuring log messages are also highlighte
1 views • 20 slides
Mastering Twitter: A Quick Guide to Social Media Success
Dive into the world of Twitter with this comprehensive guide tailored for HSE Communications Division's Digital Team. Learn the language of Twitter, how to navigate timelines, engage effectively with followers, use hashtags, retweet, send direct messages, and more. Enhance your social media skills,
0 views • 26 slides
ALCountiesTweet: Engage with Alabama Legislators on Twitter!
Get involved in the ALCountiesTweet competition to connect with Alabama legislators on Twitter. Learn about the percentage of the legislature on Twitter, voting requirements, and the impact of Twitter responses on decision-making. Follow simple steps to set up your own Twitter account and engage wit
0 views • 23 slides
Privacy Challenges in Online Social Networks
Online Social Networks (OSNs) like Facebook, Twitter, and LinkedIn have gained immense popularity with millions of users worldwide. However, these platforms present significant privacy issues, from protecting user data against unwanted exposure to the leakage of sensitive information. Challenges inc
0 views • 18 slides
Understanding Data vs. Statistics in Analysis
Data vs. Statistics: Data consists of raw facts or figures from which conclusions can be drawn, while statistics represent processed data used to support arguments. This content delves into the origins of big data, sources for data collection, and who might gather data related to specific questions.
0 views • 23 slides
Buy Twitter Follow Service in Faisalabad
Buy Twitter Follow Service in Faisalabad
0 views • 8 slides

