Understanding Year 6 SATs: A Parent's Guide to Key Stage 2 Assessments
Year 6 SATs are Standard Assessment Tests held at the end of Key Stage 2 in the UK, covering Reading, SPAG, and Maths. These tests take place in May over four days, with specific access arrangements for students with additional needs. Results are reported through raw scores, scaled scores, and judgm
5 views • 24 slides
Understanding iReady Scores and Their Significance for Your Child
iReady scores play a crucial role in identifying your child's strengths and weaknesses in reading and math. This presentation explains what iReady is, how to access the scores in HAC, and what the numbers mean in terms of scale scores and grade level expectations. By understanding these scores, pare
0 views • 10 slides
Understanding Credit Reports and Scores: A Comprehensive Overview
Explore the importance of credit reports and scores in financial empowerment through modules on reviewing credit reports, understanding credit scores, and mastering credit basics. Learn how good credit can impact your ability to obtain loans, credit cards, secure rentals, insurance coverage, and emp
3 views • 35 slides
Integration Approaches of Propensity Scores in Epidemiologic Research
Propensity scores play a crucial role in epidemiologic research by helping address confounding variables. They can be integrated into analysis in various ways, such as through regression adjustment, stratification, matching, and inverse probability of treatment weights. Each integration approach has
0 views • 20 slides
Understanding FAST Grades 2022-2023: ELA and Mathematics Scores Overview
The Understanding FAST Grades 2022-2023 provides detailed insights into the scoring system for ELA and Mathematics assessments from grades 3 to 10. It outlines the three progress monitoring windows (PMs) - PM1, PM2, and PM3 - and explains how the scores are reported at various levels. The provisiona
0 views • 9 slides
Understanding Standard Deviation, Variance, and Z-Scores
Explore the importance of variation in interpreting data distributions, learn how to calculate standard deviation, understand z-scores, and become familiar with Greek letters for mean and standard deviation. Discover the significance of standard deviation in statistical analysis and the difference b
1 views • 18 slides
Understanding the Standard Normal Distribution in Statistics
Exploring the significance of normal distributions in statistics, this lesson covers the 68-95-99.7 rule, using Table A to find probabilities and z-scores, properties of normal curves, and the standard normal distribution. Key concepts include the mean, standard deviation, and how to standardize var
4 views • 9 slides
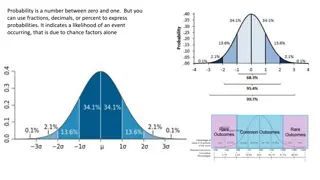
Understanding Probability and Calculating Probabilities with Z-Scores
Probability is a number between zero and one that indicates the likelihood of an event occurring due to chance factors alone. This content covers the concept of probability, the calculation of probabilities using z-scores, and practical examples related to probability in statistics. You will learn a
0 views • 12 slides
Workplace Exposure Standard for Silica Dust in Stone Benchtop Fabrication
Reduction in workplace exposure standard for respirable crystalline silica dust has been implemented, halving the national standard to 0.05 mg/m3. The new standard aims to protect workers in stone benchtop fabrication businesses from serious lung diseases caused by breathing in silica dust. Employer
1 views • 8 slides
Key Stage 2 SATs Changes and Expectations 2018/19 Overview
Changes in Key Stage 2 SATs including the introduction of a new national curriculum framework, abolition of old national curriculum levels, and transition to scaled scores. Parents can expect their child’s test results to be reported in scaled scores, with 100 representing the national standard. T
1 views • 10 slides
Understanding Correlational Research in Psychology
Correlational research in psychology focuses on determining the degree of relationship between variables without manipulation. It helps show the magnitude of association but not causation. Correlation coefficient indicates the existence, degree, and direction of the relationship between variables. P
0 views • 38 slides
VCE Greek Studies: Curriculum, Assessment, and Study Scores
VCE Greek Studies cover a range of themes over two years, focusing on areas such as Philosophy, Environment, Migration, and Greek Resistance. Students are assessed through tasks like writing, speaking, and reading comprehension. The study score is a reflection of a student's performance in compariso
0 views • 18 slides
Evaluating Bias in Value-Added Models Using Prior Scores
Outcome-based value-added (VA) models are commonly used to assess productivity in various fields. This study explores the use of prior scores to evaluate bias in VA estimates, focusing on the correlation between current teacher VA and lagged outcomes. The analysis highlights the sensitivity of balan
0 views • 38 slides
Effective Evaluation of Teaching: Understanding IDEA Scores and Student Diversity
Heather McGovern, Director of the Institute for Faculty Development, discusses interpreting IDEA scores and standard deviation values to understand student diversity and possible instructional improvements. The IDEA Center recommends using multiple evaluation sources, with student ratings comprising
1 views • 49 slides
Understanding Credit-Based Insurance Scores and Their Regulation
Credit-based insurance scores are numeric representations of insurance claim risk based on consumer credit details. Factors considered include credit history, types of accounts, recent activity, utilization, and payment history. Gender, marital status, age, address, occupation, and education are not
0 views • 10 slides
Comprehensive Analysis of Gene Expression and Regulatory Potential Through eCLIP Profiles
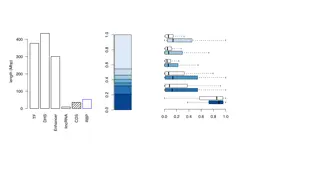
Explore a thorough examination of gene expression and regulatory potential using eCLIP profiles, shRNA, RNA-Seq, secondary structure conservation, and prioritized genes. Uncover insights on users' variants, regulator scores, nucleotide scores, RBP rank lists, mutation burden, and more. Dive deep int
3 views • 10 slides
Vacation Expenses Analysis and Z-scores Computation
Explore the concept of measuring dispersion using standard deviation units and calculating z-scores for a dataset related to vacation expenses. Learn how to interpret z-scores, analyze normal distributions, and apply statistical concepts to real-world scenarios involving amusement park trip heights.
0 views • 18 slides
Massachusetts Educational Policy Study: Long-Term Outcomes & MCAS Scores
This study from Brown University explores how high school MCAS scores in Massachusetts predict long-term success and academic skills, impacting students' college and career readiness. Findings indicate students near passing cutoffs struggle, but additional attempts can improve outcomes. MCAS scores
0 views • 37 slides
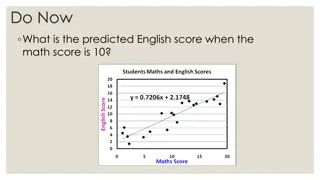
Understanding Regression Lines for Predicting English Scores
Learn how to utilize regression lines to predict English scores based on math scores, recognize the dangers of extrapolation, calculate and interpret residuals, and understand the significance of slope and y-intercept in regression analysis. Explore the process of making predictions using regression
0 views • 34 slides
Linking BIM and GIS Standard Ontologies with Linked Data
Introduction to the need for seamless data interpretation between Building Information Model (BIM) and Geographic Information System (GIS), focusing on aligning BIM and GIS standard ontologies for semantic interoperability. Addressing the challenges of data interoperability layers and the characteri
0 views • 15 slides
Probability and Normal Distribution Exercises
Solving exercises related to normal distribution and probability, including calculating probabilities based on mean and standard deviation, determining minimum guaranteed mileage for a tire company, and interpreting test scores. Utilizes data on IQ test scores and tire mileage to illustrate concepts
0 views • 5 slides
Understanding Location in a Distribution of Data
In this lesson on describing location in a distribution, you will learn how to find and interpret percentiles in quantitative data distributions, estimate values using cumulative relative frequency graphs, and understand standardized scores (z-scores). The concept is illustrated through examples lik
0 views • 16 slides
Understanding Data Distribution and Analysis in AP Statistics
Explore the concepts of percentiles, standard scores, and data transformation in AP Statistics. Learn to interpret data distributions, calculate percentiles, and examine the relationship between percentiles and quartiles. Engage in activities to analyze class heights, calculate z-scores, and underst
0 views • 11 slides
Understanding SAT Math Score Percentiles
Learn how to determine your score percentile on the math section of the SAT by using a normal distribution curve to find where your score falls relative to other students. Discover the concept of percentiles and how they reflect your position in relation to the mean and standard deviations of the sc
0 views • 39 slides
Understanding Item-Response Theory (IRT) in Educational Assessments
This lecture covers the design and use of test scores, focusing on the principles of Item-Response Theory (IRT) in large-scale international assessments. IRT aims to measure latent traits reliably by analyzing individual question responses rather than just total scores. The advantages of IRT over Cl
0 views • 53 slides
Evaluation of Teaching Methods at Stockton: Insights from IDEA and Multiple Measures
Heather McGovern, Director of the Institute for Faculty Development, shared insights on interpreting IDEA data, including criterion vs. normed scores and standard deviation analysis. The appropriate role of IDEA in evaluating teaching at Stockton involves considering validity, reliability, mean scor
0 views • 49 slides
Understanding Z-Scores in Data Analysis
Z-Scores are standardized measurements that indicate how far a data value is from the mean in a dataset. By calculating Z-scores, analysts can compare different data points and understand their relative positions within the distribution. This summary covers the concept of Z-scores, how to calculate
0 views • 19 slides
Understanding Cognitive Abilities Test (CogAT) for Educational Planning
The Cognitive Abilities Test (CogAT) is a benchmark test administered to third-grade students in the WCPSS for educational planning. The test measures verbal reasoning, math reasoning, and visual-spatial reasoning skills through different subtests and composite scores. These scores help in predictin
0 views • 17 slides
Command-Line Application for Retrieving Course Scores
Implement a command-line application that allows users to retrieve their course scores securely. The application ensures that each student can access only their own score by authenticating with their username and SSN. Scores are maintained in a file and can only be read by the root user. The program
0 views • 27 slides
Analyzing SAT Mathematics and Critical Reading Scores
This content covers a regression analysis between SAT Mathematics and Critical Reading scores, including calculating the regression line, predicting scores, identifying outliers, interpreting residuals, slopes, and y-intercepts, and assessing the relationship between exercise habits and fast-food co
0 views • 15 slides
Understanding Gender Attitudes in Southern Africa
The Gender Progress Score (GPS) survey collected responses from 15 countries in Southern Africa between 2019 and 2021 to gauge gender attitudes. With a total of 34,323 responses, the survey revealed insights on gender attitudes, with women comprising 49.5% of respondents. The scores ranged across th
0 views • 18 slides
Understanding Dual Credit Education and Eligibility Criteria
Dual credit programs allow high school students to earn college credits while still in high school, providing numerous benefits such as cost savings, weighted GPA benefits, and a smoother transition to college. Eligibility for dual credit courses is typically based on meeting criteria such as TSI sc
0 views • 16 slides
Understanding Year 6 SATs: Tests, Procedures, and Results
Year 6 SATs are compulsory assessment tests conducted in May for students in Year 6 to evaluate their skills in Mathematics, Reading, SPAG, Science, and Writing. These tests are externally marked, with results reported in raw scores, scaled scores, and judgments against the national standard. Test d
0 views • 24 slides
Understanding Standard Molar Enthalpies of Formation
Formation reactions involve substances being created from elements in their standard states, with the enthalpy change known as the standard molar enthalpy of formation (Hf). This enthalpy represents the energy released or absorbed when one mole of a compound is formed from its elements in their stan
0 views • 13 slides
Understanding Educational Growth Progression Through Analogies
Explore the analogy of a four-lap, one-mile footrace to grasp the concept of maintaining relative position in educational growth. Grade-equivalent scores and standard scores are compared to illustrate student progress over time, with vivid imagery and explanations provided to enhance understanding.
0 views • 31 slides
Understanding Scoring Scales: Meaning, Calculation, and Advantages
Scoring scales are used to assign numerical values to observations for quantifying attributes or behaviors in various fields. They provide a systematic way to evaluate or measure variables, convert qualitative data into quantitative data, and facilitate analysis and interpretation. This article disc
0 views • 22 slides
Understanding Standard Deviation and Standard Error of the Means
Standard deviation measures the variability or spread of measurements in a data set, while standard error of the means quantifies the precision of the mean of a set of means from replicated experiments. Variability is indicated by the range of data values, with low standard deviation corresponding t
0 views • 7 slides
Understanding the Uniform Bar Exam (UBE)
The Uniform Bar Exam (UBE) is a standardized test administered in multiple jurisdictions simultaneously, consisting of Multistate Performance Test (MPT), Multistate Essay Exam (MEE), and Multistate Bar Exam (MBE) components. It offers portability of scores, benefits test-takers with consistent subje
0 views • 12 slides
Analysis of National Alcohol Consumption and Happiness Scores
The study conducted a comparison between national alcohol consumption and happiness scores to determine if countries with higher alcohol consumption are also the happiest. Data from two separate datasets focusing on alcohol consumption and happiness scores of 145 countries were analyzed. The researc
0 views • 10 slides
Sensitivity Analysis of Performance by Practice Areas at Kaplan
Sensitivity analysis of performance in different practice areas at Kaplan reveals high scores in Ethics and Contract Law, and low scores in Business Law & Practice and Dispute Resolution for SQE1. For SQE2, high scores were observed in Legal Research - Dispute Resolution, Advocacy - Criminal Litigat
0 views • 13 slides


