Binomial Distribution in R Programming
Probability distributions play a crucial role in data analysis, and R programming provides built-in functions for handling various distributions. The binomial distribution, a discrete distribution describing the number of successes in a fixed number of trials, is commonly used in statistical analysi
16 views • 30 slides
Inference Tests and Chi-Square Analysis
The content discusses the application of inference tests to determine if two variables are related, focusing on categorical and quantitative variables. It provides examples related to testing fairness of a die and comparing observed and expected distributions of Skittles colors. Additionally, it cov
1 views • 16 slides
The Significance Testing Process for Population Means
Learn how to test claims about population means, including checking conditions, calculating test statistics, finding P-values, and understanding t-distributions and degrees of freedom. This lesson covers the Random and Normal/Large Sample conditions for significance tests, the modeling of standardiz
1 views • 10 slides
Tackling Skewed Data Challenges in Decentralized Machine Learning
Addressing the critical issue of skewed data in decentralized machine learning, this work explores solutions to effectively handle non-iid data distribution, focusing on communication bottlenecks, data skewness, and proposing innovative approaches for decentralized learning over skewed datasets.
0 views • 26 slides
Binomial and Poisson Distributions in Probability Theory
Understand the fundamentals of binomial and Poisson distributions through practical examples involving oil reserve exploration and dice rolling. Learn how to calculate the mean, variance, and expected outcomes of random variables in these distributions using formulas and probability concepts.
1 views • 13 slides
Basic Concepts in Statistics
This content covers fundamental concepts in statistics such as populations, samples, models, and probability distributions. It explains the differences between populations and samples, the importance of models in describing populations, and discusses various distributions like the normal and Poisson
0 views • 42 slides
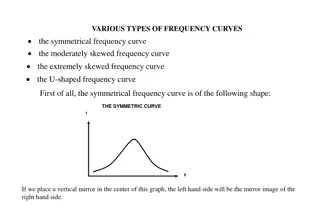
Various Types of Frequency Curves in Statistics
Explore different types of frequency curves such as symmetrical, moderately skewed, extremely skewed, and U-shaped curves. Symmetrical curves exhibit mirror images on either side, while skewed curves have longer tails on one side. Extreme skewness results in J-shaped or reverse J-shaped curves. The
1 views • 8 slides
Invariance in Posterior Distributions
Exploring the insensitivity of posterior distributions to variations in prior distributions using a Poisson model applied to pancreas data. The analysis involves calculating posterior mean and standard deviation with different Gamma prior distributions. Results showcase minimal change in outcomes ac
0 views • 7 slides
Discrete Probability Distributions
Explore the definition of random variables, probability distributions, and three types of discrete distributions - Binomial, Hypergeometric, and Poisson. Learn about the mean, variance, and standard deviation of probability distributions, as well as the difference between discrete and continuous dis
5 views • 32 slides
Decoding Sarcasm in Tweets: A Comprehensive Analysis
This research delves into the realm of sarcasm detection in tweets, utilizing a dataset of sarcastic and non-sarcastic tweets to build a model for classification. Through methods like feature extraction and model building with WEKA, the study aims to enhance the understanding of sarcasm detection on
0 views • 9 slides
Chi-Square and F-Distributions in Statistics
Diving into the world of statistical distributions, this content explores the chi-square distribution and its relationship with the normal distribution. It delves into how the chi-square distribution is related to the sampling distribution of variance, examines the F-distribution, and explains key c
1 views • 23 slides
Statistics, Big Data, and High-Dimensional Distributions
Delve into the realms of statistics, big data, and high-dimensional distributions in this visual journey that touches on topics ranging from lottery fairness to independence testing in shopping patterns. Discover insights into the properties of BIG distributions and the prevalence of massive data se
0 views • 73 slides
Probability Distributions in the 108th Congress
The composition of the 108th Congress includes 51 Republicans, 48 Democrats, and 1 Independent. A committee on aid to higher education is formed with 3 Senators chosen at random to head the committee. The probability of selecting all Republicans, all Democrats, and a mix of one Democrat, one Republi
0 views • 34 slides
Utilizing TI-83/84 and TI-Nspire for Teaching AP Statistics Units 3.5
Explore the integration of TI-83/84 and TI-Nspire in supporting teaching and learning in Units 3.5 of the AP Statistics course, covering collecting data, probability, random variables, probability distributions, and sampling distributions. Dive into a real-world example involving the fit of lids on
1 views • 13 slides
MCMC Algorithms and Gibbs Sampling in Markov Chain Monte Carlo Simulations
Markov Chain Monte Carlo (MCMC) algorithms play a crucial role in generating sequences of states for various applications. One popular MCMC method, Gibbs Sampling, is particularly useful for Bayesian networks, allowing the random sampling of variables based on probability distributions. This process
1 views • 7 slides
Trends in Income and Wealth Inequality in the United States, 1995-2016
Recent research highlights the increasing inequality in joint income and wealth distributions in the United States from 1995 to 2016. The focus is shifting towards wealth distribution alongside income, revealing the rise in wealth inequality compared to income. Data limitations and skewed distributi
2 views • 20 slides
Random Variables and Probability Distributions
Random variables play a crucial role in statistics, representing outcomes of chance events. This content delves into discrete and continuous random variables, probability distributions, notation, and examples. It highlights how these concepts are used to analyze data and make predictions, emphasizin
0 views • 25 slides
Statistical Distributions and Properties
Statistical Process Control (SPC) involves sampling to assess the quality-related characteristics of a process. Different distributions arise in SPC, such as binomial and geometric distributions, depending on the type of data collected. These distributions help infer the current state of a process a
0 views • 16 slides
The Normal Distribution in Data Analysis
The normal distribution, also known as the bell-shaped or Gaussian distribution, is defined by the mean and standard deviation of quantitative data. It helps determine the range of values containing specific percentages of observations. Identifying frequency, probability, mean, and the relationship
0 views • 19 slides
Statistical Distributions in Physics
Exploring the connections between binomial, Poisson, and Gaussian distributions, this material delves into probabilities, change of variables, and cumulative distribution functions within the context of experimental methods in nuclear, particle, and astro physics. Gain insights into key concepts, su
0 views • 13 slides
Histogram Shapes and Distribution Patterns in Statistics
Explore the shapes of histograms and distribution patterns, including symmetric, skewed, bimodal, and uniform distributions. Learn to identify variables that are likely to be uniformly distributed, skewed right, skewed left, or symmetric in real-world data sets. Gain insights into key concepts like
0 views • 55 slides
Analysis of 2016 Standardized Matriculation Exam Results in Foreign Languages
Analysing the 2016 standardized matriculation exam results in English and French, this study evaluates the appropriateness of CEFR target levels, investigates score distributions, explores differences based on gender and school types, and examines the impact of years of learning on French proficienc
0 views • 5 slides
Probability Distributions in Engineering Mathematics-III
Explore the concept of random variables, types of distributions such as binomial, hypergeometric, and Poisson, and the distinction between discrete and continuous variables. Enhance your knowledge of probability distributions with practical examples and application scenarios.
0 views • 57 slides
Channel Popularity Dynamics in IPTV Systems
Explore the dynamics of channel popularity in large commercial IPTV systems, focusing on distribution, stability, and modeling. The study reveals skewed popularity distributions and strong correlations between channel accesses and dwell time. Gain insights into user behaviors and system performance
0 views • 22 slides
Advanced Concepts in Association Analysis: Handling Categorical Attributes
Explore advanced concepts in association analysis, focusing on the handling of categorical attributes. Learn how to apply association analysis to non-asymmetric binary variables, including examples and potential solutions for skewed attribute value distributions. Discover techniques for managing att
0 views • 48 slides
Bayesian Statistics with Stan and brms: A Feasible Approach to Inference
Bayesian inference and how it can be applied feasibly in research using Stan and brms. Explore the concept of giving prior distributions to model parameters and obtaining posterior distributions. Learn about Markov Chain Monte Carlo (MCMC) simulation and Hamiltonian Monte Carlo (HMC) for faster conv
0 views • 19 slides
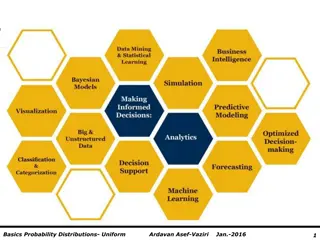
Basics Probability Distributions- Uniform Ardavan Asef-Vaziri Jan.-2016 1
Triangular Probability Distributions involve generating random variables based on specified parameters. By understanding the concepts of height, area, and likelihood, one can effectively compute values and make informed decisions in various scenarios. This content delves into the calculation methods
0 views • 17 slides
Retrieving True Part Distributions: Gauge Insights
This presentation delves into retrieving arbitrary true part distributions from measured distributions and gauge characteristics, explaining the importance, challenges behind estimation computations, and a demonstration of a new JMP Addin. Understand the need for determining True Part Distribution (
0 views • 14 slides
Probabilistic System Analysis Lecture: Chapter 6 - Continuous Probability Distributions
In this lecture series by Dr.-Ing. Erwin Sitompul at President University, explore Chapter 6 focusing on some key continuous probability distributions like the uniform distribution and normal distribution. Understand the density functions, mean, variance, and practical applications of these distribu
0 views • 26 slides
Understanding Binary Search Trees: Properties and Limitations
Binary search trees (BST) are binary tree data structures with specific properties regarding the values stored in nodes. This includes the left subtree containing nodes with lesser values and the right subtree containing nodes with greater values. However, BSTs have limitations such as average searc
0 views • 21 slides
Virtual Training on Health Savings Accounts Part 4 - Distributions Core
This virtual training addresses the core aspects of distributions related to Health Savings Accounts (HSAs), providing essential insights and guidance for managing HSA distributions effectively. Join to enhance your understanding and make informed decisions regarding HSA distributions.
0 views • 17 slides
Coping with Skewed Content Popularity in MapReduce Clusters
Explore challenges and solutions for managing skewed content popularity in MapReduce clusters, addressing issues like slot contention, replication strategies, storage space optimization, and task queue contention. Learn from real-world production logs and discover effective ways to handle popularity
0 views • 28 slides
Applications of Poisson, Geometric, and Modified Geometric Distributions in ECE 313 Lecture
Explore the applications of important discrete distributions such as Poisson, Geometric, and Modified Geometric in electrical and computer engineering, as discussed in ECE 313 Probability with Engineering Applications Lecture 10 by Ravi K. Iyer. Topics include random variables, examples of geometric
0 views • 35 slides
Understanding Distribution in Statistics & Probability Analysis
Explore different types of distributions such as discrete uniform, Bernoulli, and binomial distributions with examples and explanations. Discover how these distributions are applied in various scenarios to analyze data and make informed decisions.
0 views • 28 slides
Understanding Distributions in Statistics and Probability
Learn about distributions of data and how to interpret them using histograms and box-and-whisker plots. Discover the shapes of distributions and how they impact statistical analysis in this comprehensive guide.
1 views • 15 slides
Families of Probability Distributions and Examples
Explore common families of probability distributions such as Bernoulli and Binomial distributions through examples like Shaquille O'Neal's free throw shooting. Understand the concepts, calculations, and applications in probability theory.
0 views • 38 slides
Understanding Sampling Distributions of Means and Standard Error
Explore the concept of sampling distributions, the long-run perspective in probability, and the theoretical nature of sampling distributions through informative visuals and activities. Learn how sample size and number of samples impact the normality of distributions.
1 views • 37 slides
Understanding Basic Statistical Principles and Analysis Techniques
Explore essential statistical concepts like central tendency, dispersion, standardization, mode, median, mean, frequency distributions, and skewed distributions. Learn how these tools are used to analyze data effectively and make informed decisions in various fields.
0 views • 33 slides
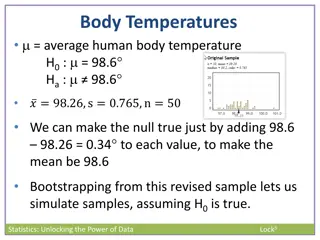
Understanding Bootstrap and Randomization Distributions
Learn how to simulate samples, generate randomization distributions, and compare bootstrap and randomization distributions in statistical analysis. Explore the concept of shifting distributions for hypothesis testing.
0 views • 12 slides
Understanding Distribution Characteristics: Shape, Center, Spread
Learn about the key aspects of describing distributions, including shape (symmetric, skewed), center (mean, median), spread (range), and identifying unusual features like outliers and gaps. Practice describing various distributions to enhance your data analysis skills.
0 views • 13 slides
