
I02: Interactive Online Learning Environment
Explore the IO2 interactive online learning environment, which focuses on delivering all online learning components and tools. The methodology includes an interactive learning platform, development and integration of learning tools, communication tools, and a mobile application. Dive into the IO2 le
1 views • 8 slides

DCU Power BI 101 Guide for End Users: Interactive Data Visualization Software
Learn about Power BI, an interactive data visualization software by Microsoft, focusing on business intelligence. The guide covers getting started, differences between Service and Desktop versions, and troubleshooting tips. Explore downloading reports, visuals, and summary data, enhancing your data
1 views • 13 slides

NCI Data Collections BARPA & BARRA2 Overview
NCI Data Collections BARPA & BARRA2 serve as critical enablers of big data science and analytics in Australia, offering a vast research collection of climate, weather, earth systems, environmental, satellite, and geophysics data. These collections include around 8PB of regional climate simulations a
8 views • 22 slides

5 Advantages of Interactive Touchscreen Displays
Techno Edge Systems LLC offers cutting-edge displays with five key advantages. Enhance engagement with interactive content, promote collaboration, improve presentations, streamline information access, and create memorable experiences. Interactive Touch Screen Rental in Dubai. Contact us at 054-4653
3 views • 8 slides
Ask On Data for Efficient Data Wrangling in Data Engineering
In today's data-driven world, organizations rely on robust data engineering pipelines to collect, process, and analyze vast amounts of data efficiently. At the heart of these pipelines lies data wrangling, a critical process that involves cleaning, transforming, and preparing raw data for analysis.
2 views • 2 slides
Data Wrangling like Ask On Data Provides Accurate and Reliable Business Intelligence
In current data world, businesses thrive on their ability to harness and interpret vast amounts of data. This data, however, often comes in raw, unstructured forms, riddled with inconsistencies and errors. To transform this chaotic data into meaningful insights, organizations need robust data wrangl
0 views • 2 slides

Bioinformatics for Genomics Lecture Series 2022 Overview
Delve into the Genetics and Genome Evolution (GGE) Bioinformatics for Genomics Lecture Series 2022 presented by Sven Bergmann. Explore topics like RNA-seq, differential expression analysis, clustering, gene expression data analysis, epigenetic data analysis, integrative analysis, CHIP-seq, HiC data,
1 views • 36 slides
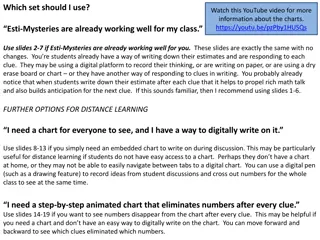
Interactive Esti-Mystery Chart Activity for Classroom Engagement
Engage your class with interactive Esti-Mystery charts to enhance math skills through estimation and deduction. Choose from different sets based on your classroom needs for in-person or distance learning. The activity involves narrowing down possibilities based on clues provided as students estimate
1 views • 19 slides

Mean, Median, and Mode in Data Analysis
Explore the concepts of mean, median, and mode in data analysis through engaging visuals and interactive exercises. Learn about the different types of averages, how to calculate them, and their significance in understanding datasets. Practice finding the mean of various sets of data and solve real-w
0 views • 10 slides
Exploratory Data Analysis (EDA) for Effective Data Insights
Exploratory Data Analysis (EDA) is a crucial approach for analyzing data by utilizing various techniques to extract insights, identify anomalies, and visualize trends. By leveraging EDA using tools like Pandas, researchers can improve their understanding of data variables, detect errors, and explore
3 views • 14 slides

Qualitative Data Analysis Techniques in Research
The purpose of data analysis is to organize, structure, and derive meaning from research data. Qualitative analysis involves insight, creativity, and hard work. Researchers play a crucial role as instruments for data analysis, exploring and reflecting on interview discussions. Steps include transcri
2 views • 27 slides

Interactive Plotting with ggplot and Shiny: Enhancing Galaxy Visualization Tools
Explore the concept of transforming existing ggplot2 Galaxy tools into interactive platforms using Shiny or Plotly implementations. Discover a variety of plot types available with ggplot2, such as barplots, violin plots, PCA plots, and heatmaps. Utilize additional plot options through various geom_*
3 views • 9 slides

Data Governance and Data Analytics in Information Management
Data Governance and Data Analytics play crucial roles in transforming data into knowledge and insights for generating positive impacts on various operational systems. They help bring together disparate datasets to glean valuable insights and wisdom to drive informed decision-making. Managing data ma
1 views • 8 slides

Data Analysis in Nursing Research
Data analysis in nursing research involves rendering individual data points into meaningful information, leading to knowledge generation. The process includes qualitative and quantitative analysis to organize and interpret data effectively. Techniques such as data reduction, data display, and conclu
2 views • 26 slides

Importance of Data Preparation in Data Mining
Data preparation, also known as data pre-processing, is a crucial step in the data mining process. It involves transforming raw data into a clean, structured format that is optimal for analysis. Proper data preparation ensures that the data is accurate, complete, and free of errors, allowing mining
1 views • 37 slides
Insights on Interactive Narrative and New Media
Discussion on the evolution of interactive narrative and new media, highlighting Janet Murray's work, the complementary skills of hackers and bards, the concept of the Holodeck as a universal fantasy machine, Janeway's Holonovel, and the early reactions to new media technologies. Topics covered incl
0 views • 22 slides

Interactive Science Simulations by PhET - Engaging Learning Experiences
Explore PhET Interactive Simulations founded by Nobel Prize physicist Carl Wieman, offering over 120 interactive simulations across various scientific disciplines. From Energy Skate Park to Molecule Shapes, these simulations provide engaging, game-like experiences for students and scientists alike.
0 views • 13 slides
Learn About Common, Proper, and Collective Nouns with Interactive Worksheet
Explore the differences between common, proper, and collective nouns through an interactive worksheet. Discover how each type of noun names people, places, or things, and test your understanding with engaging activities. Dive into the world of nouns and enhance your language skills in an interactive
0 views • 74 slides

Data Collection and Analysis for Businesses
Explore the impact and role of data utilization in organizations through the investigation of data collection methods, data quality, decision-making processes, reliability of collection methods, factors affecting data quality, and privacy considerations. Two scenarios are presented: data collection
1 views • 24 slides

Data Analysis and Passage Analysis Project Proposal
This project proposal by Anthony Yang focuses on developing a Java program for data analysis and passage analysis. The motivation behind the project is to gain more knowledge in computer science and statistics-related topics while utilizing technology to extract useful insights from data. The propos
2 views • 8 slides

Efficient Interactive Proof Systems Overview
This document discusses various aspects of efficient interactive proof systems, including doubly efficient IPs, simple doubly efficient IPs, and the Sum-Check Protocol. It explains concepts such as completeness, soundness, and strategies for verifiers and provers. The content covers examples like NP
0 views • 12 slides
Challenges in Explaining the Data: A Research Agenda for the Future
Explore the complexities of explaining data, from understanding causality to interactive processes and visualizations. Judea Pearl's work on causality and Halpern's foundational research shape the emerging science of explaining data, highlighting the limitations and challenges faced by data analysts
0 views • 5 slides
Creating Interactive Reports Using Excel Pivot Tables - Guide by Brandon Aragon
Learn how to create interactive reports using Excel pivot tables with this comprehensive guide by Brandon Aragon, Research Technician at CSUSB. Explore topics such as preparing data, using the Pivot Table Wizard, and enhancing decision-making through data analysis and reporting. Discover the benefit
0 views • 25 slides

The Influence of Words on Sound Recognition in Interactive and Non-interactive Models
Influence of words on sound recognition differs in interactive and non-interactive models. In interactive models, sounds activate words in the mind in a feedback loop, while in non-interactive models, two routes exist to recognize a sound, one through words and the other directly through sounds. Thi
1 views • 6 slides

Interactive Microbiome Data Analysis with Parallel-Meta Suite
Conduct interactive and rapid microbiome data analysis on various platforms using Parallel-Meta Suite. This software, developed by a team from Qingdao University, simplifies the process from installation to verification. Utilize the step-by-step guide to download, install, and verify the software to
0 views • 13 slides

Big Data and Ethical Considerations in Data Analysis
Big data involves analyzing and extracting information from large and complex datasets that traditional software cannot handle. AI algorithms play a crucial role in processing big data to find patterns that humans may overlook. Ethical considerations arise in defining what is "interesting" in the da
0 views • 25 slides

Introduction to IBM SPSS Modeler: Association Analysis and Market Basket Analysis
Understanding Association Analysis in IBM SPSS Modeler 14.2, also known as Affinity Analysis or Market Basket Analysis. Learn about identifying patterns in data without specific targets, exploring data mining in an unsupervised manner. Discover the uses of Association Rules, including insights into
1 views • 18 slides

The Impact of Interactive Teaching on Conceptual Development in Physics
Investigating the effectiveness of interactive teaching in promoting conceptual development in physics, focusing on student learning in both conventional and interactive classrooms. Research examines student understanding through qualitative reasoning questions, such as the baseball bat scenario, to
0 views • 62 slides

Interactive Time Bingo Game for Learning English
Engage students in a fun and educational way with the Interactive Time Bingo Game. Using two stacks of cards, students practice asking and answering questions about daily routines and activities related to specific times. The game encourages speaking and writing skills as they create sentences based
0 views • 14 slides
Advancements in Interactive Proofs for Efficient Computation
Recent developments in interactive proofs focus on enhancing the efficiency of computations outsourced to untrusted servers, addressing concerns related to correctness and privacy. Solutions like doubly efficient interactive proofs offer a secure way to delegate computations while minimizing relianc
0 views • 25 slides

Constant Round Interactive Proofs for Delegating Computations
The research explores techniques for securely delegating computations to the cloud, addressing concerns of correctness and privacy through interactive proofs and efficient verification methods. It compares classical and doubly efficient interactive proofs, emphasizing the importance of computational
0 views • 43 slides

Interactive Data Visualization Tools and Techniques Quiz
This quiz tests knowledge on data visualization tools, techniques, and concepts. Questions cover topics such as the use of EDA in data visualization, interactive graph outputs, historical figures in data visualization, GIS data types in SAS/JMP, outlier detection in 3D scatterplots, and limitations
1 views • 11 slides
Enhancing Interactive Job Efficiency in DLWorkspace Cloud Computing
Explore how to optimize interactive job experiences for researchers in DLWorkspace by bridging the gap between cloud and local environments, offering pre-defined job templates, and implementing efficient networking solutions such as Flannel and Kubernetes. This includes facilitating interactive job
0 views • 15 slides
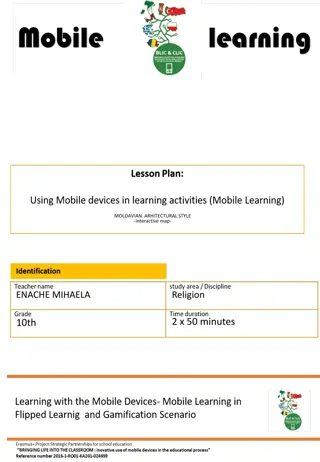
Moldavian Architectural Styles Interactive Virtual Library Lesson Plan
Conceive a virtual library project where students explore Moldavian architectural styles through interactive maps, dialog boxes, hyperlinks, and quizzes. Groups create interactive portfolios based on gathered information to present and publish the best work. The teacher mentors and facilitates learn
0 views • 4 slides
Data vs. Statistics in Analysis
Data vs. Statistics: Data consists of raw facts or figures from which conclusions can be drawn, while statistics represent processed data used to support arguments. This content delves into the origins of big data, sources for data collection, and who might gather data related to specific questions.
0 views • 23 slides
Wrangler: Interactive Visual Specification of Data Transformation
Data wrangling is a crucial step before analysis, involving restructuring, correcting errors, and combining sources. Addressing the time-consuming nature of data preparation, Wrangler offers a user-friendly interface with a declarative transformation language, supporting various transforms and inter
0 views • 42 slides
Introduction to Data Analysis in Geophysics using MATLAB Graphics Handles
Practice interactive input, file reading, and plotting in MATLAB Graphics Handles lab. Explore ways to improve graphics in Geophysics data analysis. Learn basic histogram plot representation with properties and understand the functionalities provided in MATLAB for handling geophysical data through g
0 views • 21 slides

Interactive Proofs in Complexity Theory
Delve into the realm of interactive proofs in complexity theory, exploring concepts such as completeness, soundness, and efficiency. Discover how interactive proof systems can be utilized in scenarios like graph isomorphism and their implications on the complexity classes NP and coNP. Uncover the in
0 views • 40 slides
Quantitative Data Analysis in Research
Dive into the world of quantitative data analysis with a focus on frequencies, central tendency, dispersion, and standard deviation. Explore the collection and analysis of numerical data, levels of measurement, and methods for quantifying social concepts. Learn about the importance of capturing data
0 views • 25 slides
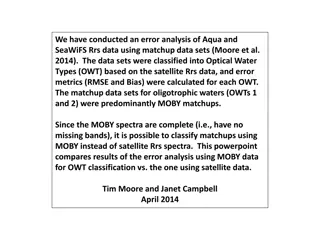
Comparison of Aqua and SeaWiFS Rrs Data Error Analysis Using MOBY Data
An error analysis was conducted on Aqua and SeaWiFS Rrs data using matchup data sets classified into Optical Water Types (OWT). The analysis compared results of OWT classification using MOBY data versus satellite data, highlighting differences in error metrics such as RMSE and Bias. Aqua and SeaWiFS
1 views • 12 slides