The Impact of Global Financial Cycle on Capital Flows
Global Financial Cycle (GFCy) has been a topic of interest among researchers, with studies analyzing its effects on capital flows. While some argue for its significance, others find little evidence of substantial influence. Understanding GFCy is crucial for policymakers to navigate synchronized economic conditions and address potential vulnerabilities in emerging markets. This research emphasizes the need to identify and quantify GFCy to better manage capital flows and financial risks on a global scale.

Download Presentation

Please find below an Image/Link to download the presentation.
The content on the website is provided AS IS for your information and personal use only. It may not be sold, licensed, or shared on other websites without obtaining consent from the author. Download presentation by click this link. If you encounter any issues during the download, it is possible that the publisher has removed the file from their server.
E N D
Presentation Transcript
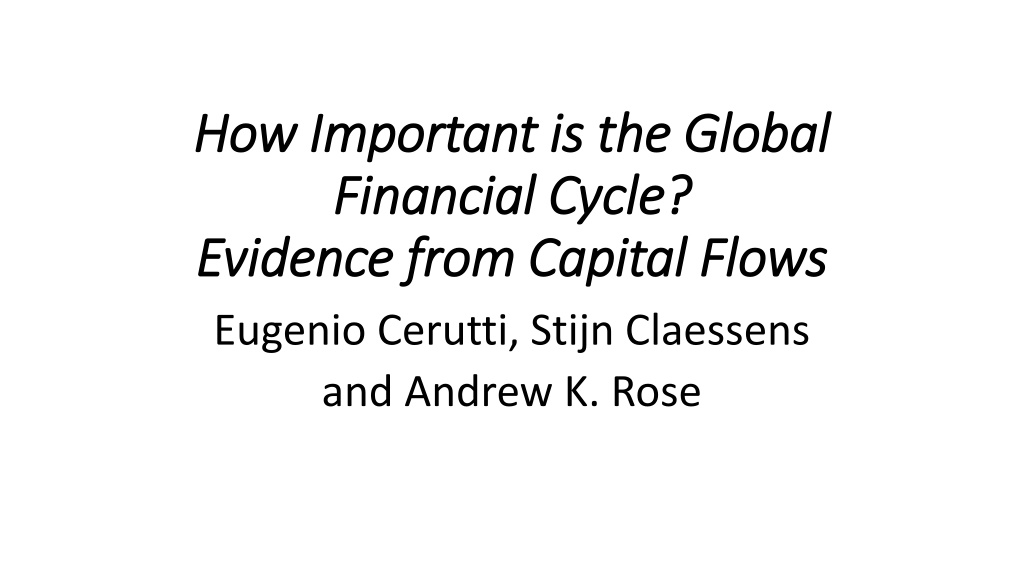
How Important is the Global How Important is the Global Financial Cycle? Financial Cycle? Evidence from Capital Flows Evidence from Capital Flows Eugenio Cerutti, Stijn Claessens and Andrew K. Rose
Q: How Important is Global Financial Cycle for Capital Flows? Rey and others: very Risky asset prices around the globe, from stocks to corporate bonds, have a strong common component. So do capital flows The global financial cycle can be related to monetary conditions in the centre country and to changes in risk aversion and uncertainty capital flows are largely driven by a global factor - Rey (2013, pp 1-2) Rose: Quantifying Global Financial Cycle Effect on Capital Flows 2
Key Finding: Effects of Global Financial Cycle on capital flows just not that important just not that important Plain vanilla approach: conventional techniques, models, metrics Use capital flow panel dis-aggregated by direction/type, 1990Q1- 2015Q4, 85 countries Measure GFCy via: a) observables in central countries (VIX) and b) unobservables (commonality in capital flows, via extracted dynamic factors) Little evidence of significant, conspicuous GFCy Using both measures gives upper bound of 25% of capital flow variation explained by GFCy Often much less Rose: Quantifying Global Financial Cycle on Capital Flows 3
Much Interest in Global Financial Cycle (GFCy) Literature Rey and co-authors (many) Forbes and Warnock (2012) Ghosh et al (2014) Koepke (2015) Bruno and Shin (2015a, 2015b) Avdjviev et al (2016 a,b) IMF 2017 Annual Research Conference RIDGE 2017 Conference Rose: Quantifying Global Financial Cycle on Capital Flows 4
Serious Policy Implications Very synchronized GFCy implies EM policymakers can do little more than insulate their economies (capital controls, macro-prudential, ...) and blame US for exogenous shocks: As capital flows respond to US monetary policy, they may not be appropriate for the cyclical conditions of many economies... - Rey (2015, pp 9-10) Rose: Quantifying Global Financial Cycle on Capital Flows 5
Identifying GFCy: Empirical Strategy GFCy intrinsically unobservable Guiding idea: if GFCy consequential, should drive high proportion of fluctuations in most types of capital flows (and domestic credit creation, asset prices, ...) in many places, much of the time High commonality in financial conditions, manifest in capital flows, driven by observable global determinants The initial motivation: if the GFCy is so obviously important, why didn t we already know about it? Plain vanilla approach: model, data, estimation, metrics . Rose: Quantifying Global Financial Cycle on Capital Flows 6
Two Approaches to Measuring GFCy 1. (Direct) Examine observable fundamental GFCy drivers, center- country macro/financial determinants of capital flows Which variables? Which center countries? Literature delivers consensus (VIX), but check with many variables, countries 2. (Indirect) Examine observable commonality via factors Extract common dynamic factors (following Rey) Attribute all commonality to GFCy to be conservative, establish upper bound for GFCy impact Ignore correlated shocks bc commodity price movements, sunspots, contagion, etc. Rose: Quantifying Global Financial Cycle on Capital Flows 7
Fundamentals: Volatility VIX as consensus Ticker symbol for CBOE implied near-term volatility of S&P 500 index options (end of quarter) Used extensively in literature: e.g., Passari and Rey (2015, p683) VIX as our proxy for the global financial cycle ... Large gross cross-border flows are moving in tandem across countries regardless of the exchange rate regime, they tend to rise in periods of low volatility and risk aversion and decrease in periods of high volatility and risk aversion, as measured by the VIX Also used by Cerutti, Claessens, and Ratnovski (2017), Obstfeld et al. (2017), Advjiev et al. (2016), Bruno and Shin (2015a, b), Fratzscher (2012), Forbes and Warnock (2012) ... Robustness: use VDAX (Germany), VSTOXX (EMU), IVI (UK) Rose: Quantifying Global Financial Cycle on Capital Flows 8
Fundamentals, continued Use seven other fundamentals for sensitivity analysis as well 1. Nominal policy interest rate (FedFunds/UK Base/Euro Area deposit) 2. Ex post real rate (using realized CPI inflation) 3. TED spread (3-m LIBOR government rate) 4. Yield curve slope (10yr 3m government rates) 5. GDP growth 6. Real effective (CPI) exchange rate growth (Shin) 7. M2 growth Default center-economy is USA Use UK, EMU for sensitivity analysis Rose: Quantifying Global Financial Cycle on Capital Flows 9
Capital Flow Data: Also Conventional Conventional Balance of Payments Series, 1990Q1-2015Q4, 85 countries (with gaps) Usually focus on 63 small countries Exclude US, UK, actual/future EMU members, Japan Two directions (in/out) Gross inflows/outflow: net transactions by foreigners/domestic residents Different types Foreign Direct Investment (FDI) Portfolio Equity Portfolio Debt Sometimes aggregate portfolio equity and debt as Portfolio Bank Credit (subset of other investment liabilities, of which borrowers are banks ) Rose: Quantifying Global Financial Cycle on Capital Flows 10
Factors: Measuring Capital Flow Commonality Create 180 common factors to ensure insensitivity 2 time spans (start 1990Q1 and 1996Q1; end 2015Q4) 3 sets of countries (advanced/emerging/both) 2 directions (in/out) 4 major types (FDI/debt/equity/credit) (also: portfolio debt+equity) 3 estimators Dynamic factor with 1 lag, extract largest eigenvalue factor (Miranda Agrippino-Rey) Ditto, with 2 lags Traditional static factor Ex: use dynamic factor analysis to extract a factor from fifteen emerging markets over 1990Q1-2015Q4 for FDI inflows Include this in FDI inflow equations below Rose: Quantifying Global Financial Cycle on Capital Flows 11
(National) Capital Flow Equations Panel regressions in paper indicate national heterogeneity So estimate disaggregate capital flow equations (over time) with LS: CAPFLOWd,e,i,t= ijUSFUNDjt + kFACd,ekt + i + d,e,i,t for country i Regressand: capital flows (% GDP) for direction/type/country GFCy Regressors: [Direct] Eight fundamentals (VIX, nominal and real rates, ) [Indirect] Two factors for relevant capital flow (advanced/emerging) By Design: ignore dynamics, national demand/supply shocks Deliberately attribute all fit to GFCy Rose: Quantifying Global Financial Cycle on Capital Flows 12
(National) Capital Flow Equations, continued CAPFLOWd,e,i,t= ijUSFUNDjt + kFACd,ekt + i + d,e,i,t for country i Push-Pull methodology: industry standard since Calvo et al Used recently by almost all those on stage! Koepke s 2015 survey lists over 40 studies Usual focus is coefficients; here, we focus on goodness of fit Estimate only for small countries (those affected by GFCy) 63 countries, 2 directions, 5 types of capital flows Hence many (598) equations estimated Summarize via histograms of R standard measure, small df penalty compared to R2 2 Rose: Quantifying Global Financial Cycle on Capital Flows 13
National Capital Flow Time-Series Regressions Fit of Country Time-Series Capital Flow Regressions 2s, small countries 1990Q1-2015Q4 Histograms of (up to 598) adjusted R All Inflows Outflows All Portfolio Mean=.12 Mean=.14 Mean=.10 Mean=.11 0 1 2 3 4 0 1 2 3 4 0 1 2 3 4 0 1 2 3 4 -.2 0 .25 .5 1 -.2 0 .25 .5 1 -.2 0 .25 .5 1 -.2 0 .25 .5 1 FDI Inflows Debt Inflows Equity Inflows Credit Inflows Mean=.25 Mean=.09 Mean=.12 Mean=.13 3 0 1 2 3 4 5 0 1 2 3 4 0 1 2 3 4 2 1 0 -.2 0 .25 .5 1 -.2 0 .25 .5 1 -.2 0 .25 .5 1 -.2 0 .25 .5 1 FDI Outflows Debt Outflows Equity Outflows Credit Outflows Mean=.14 Mean=.10 Mean=.14 Mean=.02 0 1 2 3 4 5 0 2 4 6 8 3 3 2 2 1 1 0 0 -.2 0 .25 .5 1 -.2 0 .25 .5 1 -.2 0 .25 .5 1 -.2 0 .25 .5 1 Regressors: Adv/EM 26-yr dyn factors, 8 US var's (VIX/TED/yield/policy/real/growth/REER chg/M2 growth) Rose: Quantifying Global Financial Cycle on Capital Flows 14
Zooming in to the top-left Fit of Country Time-Series Capital Flow Regressions Histogram of 598 adjusted R2s, small countries 1990Q1-2015Q4; Mean=.12 4 3 2 1 0 -.2 Model: Adv/EM 26-yr dyn factors, 8 US var's (VIX/TED/yield/policy/real/growth/REER chg/M2 growth) 0 .25 .5 1 Rose: Quantifying Global Financial Cycle on Capital Flows 15
Sensitivity Analysis 2) Histograms indicate poor fit (.25 an upper-bound on mean R Check with robustness checks presented in box plots Box covers (25th, 75th) percentile of R Median marked with vertical bar Whiskers extend to adjacent values , extrema within 150% interquartile range Outliers marked individually .25 red vertical line helps keep track Disaggregated by direction/type of capital flow Warning: many poorly fitting equations follow! 2statistics Rose: Quantifying Global Financial Cycle on Capital Flows 16
Box Plots: National Capital Flows Time-Series Fit of Country Time-Series Capital Flow Regressions Box-Plots of Adjusted/Raw R2s, Different Samples/Specifications Adj R2, any data Adj R2, all 26 years Adj R2, no US Vars FDI FDI FDI Debt Debt Debt Inflow Inflow Inflow Equity Equity Equity Credit Credit Credit FDI FDI FDI Debt Debt Debt Outflow Outflow Outflow Equity Equity Equity Credit Credit Credit -.25 0 .25 .5 .75 1 -.25 0 .25 .5 .75 1 -.25 0 .25 .5 .75 1 Raw R2, any data Raw R2, all 26 years Raw R2, no US Vars FDI FDI FDI Debt Debt Debt Inflow Inflow Inflow Equity Equity Equity Credit Credit Credit FDI FDI FDI Debt Debt Debt Outflow Outflow Outflow Equity Equity Equity Credit Credit Credit 0 .25 .5 .75 1 0 .25 .5 .75 1 0 .25 .5 .75 1 8 contemporary US vars, Adv + EM 26-yr dynamic factors, intercept; small countries 1990Q1-2015Q4 Rose: Quantifying Global Financial Cycle on Capital Flows 17
Different Specifications Fit of Country Time-Series Capital Flow Regressions Box-Plots of Adjusted R2s, Different Samples/Specifications Drop Dynamic Factors Substitute Static Factors Substitute MAR Factors FDI FDI FDI Debt Debt Debt Inflow Inflow Inflow Equity Equity Equity Credit Credit Credit FDI FDI FDI Debt Debt Debt Outflow Outflow Outflow Equity Equity Equity Credit Credit Credit -.25 0 .25 .5 .75 1 -.25 0 .25 .5 .75 1 -.5-.25 0 .25 .5 .75 1 Add 4 lags of the VIX Add 1 lag of all US vars Add EMU UK fund vars FDI FDI FDI Debt Debt Debt Inflow Inflow Inflow Equity Equity Equity Credit Credit Credit FDI FDI FDI Debt Debt Debt Outflow Outflow Outflow Equity Equity Equity Credit Credit Credit -.25 0 .25 .5 .75 1 -.25 0 .25 .5 .75 1 -.5-.25 0 .25 .5 .75 1 Default: 8 US vars, Adv/EM 26-yr dynamic factors, intercept; small countries 1990Q1-2015Q4 Rose: Quantifying Global Financial Cycle on Capital Flows 18
Different Samples Fit of Country Time-Series Capital Flow Regressions Box-Plots of Adjusted R2s, Different Samples 2009 Coefficient Break Drop >8% obs Drop Advanced FDI FDI FDI Debt Debt Debt Inflow Inflow Inflow Equity Equity Equity Credit Credit Credit FDI FDI FDI Debt Debt Debt Outflow Outflow Outflow Equity Equity Equity Credit Credit Credit -.5 -.250 .25 .5 .75 1 -.25 0 .25 .5 .75 1 -.25 0 .25 .5 .75 1 5% Winsorized Drop 1990-1995 Drop >|2.5 | Residuals FDI FDI FDI Debt Debt Debt Inflow Inflow Inflow Equity Equity Equity Credit Credit Credit FDI FDI FDI Debt Debt Debt Outflow Outflow Outflow Equity Equity Equity Credit Credit Credit -.5-.25 0 .25 .5 .75 1 -.25 0 .25 .5 .75 1 -.25 0 .25 .5 .75 1 8 contemporary US vars, Adv + EM 26-yr dynamic factors, intercept; small countries 1990Q1-2015Q4 Rose: Quantifying Global Financial Cycle on Capital Flows 19
Cutting the Sample Further Fit of Country Time-Series Capital Flow Regressions Box-Plots of Adjusted R2s, Different Samples Drop low Capital Mobility East/Cen Asia, Pac, Europe Band/Floating Exchange Rate FDI FDI FDI Debt Debt Debt Inflow Inflow Inflow Equity Equity Equity Credit Credit Credit FDI FDI FDI Debt Debt Debt Outflow Outflow Outflow Equity Equity Equity Credit Credit Credit -.25 0 .25 .5 .75 1 -.25 0 .25 .5 .75 1 -.5-.25 0 .25 .5 .75 1 Drop GDP per capita<$5k Drop E/C Asia, Pac & Eur Currency Union/Board/Peg FDI FDI FDI Debt Debt Debt Inflow Inflow Inflow Equity Equity Equity Credit Credit Credit FDI FDI FDI Debt Debt Debt Outflow Outflow Outflow Equity Equity Equity Credit Credit Credit -.25 0 .25 .5 .75 1 -.25 0 .25 .5 .75 1 -.5-.25 0 .25 .5 .75 1 8 contemporary US vars, Adv + EM 26-yr dynamic factors, intercept; small countries 1990Q1-2015Q4 Rose: Quantifying Global Financial Cycle on Capital Flows 20
Summary Focus here: quantifying importance of GFCy for capital flows Coming soon: credit growth, asset prices Panel regressions, national capital flow equations, event studies Plain vanilla approach: data, statistical metrics, models, techniques Measure GFCy both directly and indirectly Up to eight fundamentals for three large economies, though focus on VIX Also ... commonality, extracted from dynamic factor models Conservative approach All explanatory power attributed to GFCy Ignore coefficient signs, sizes (usual focus) ... which are often bizarre (Table A3) Poor fit; typically < 25% variation explained, often much less! Can find exceptions, but they are exceptions Rose: Quantifying Global Financial Cycle on Capital Flows 21
Conclusion Global Financial Cycle simply not that important in understanding capital flows Capital flows of peripheral countries explained by idiosyncratic phenomena If foreign: difficult to put in place systematic policies to screen good from bad capital flows If domestic (likely): periphery country needs to take ownership Harder to blame center countries for volatility if does not stem from center Caveat: GFCy can appear elsewhere (e.g. asset prices and credit) Our future research Rose: Quantifying Global Financial Cycle on Capital Flows 22
More Motivation There is a global financial cycle in capital flows, asset prices, and in credit growth. This cycle co-moves with the VIX, a measure of uncertainty and risk aversion of the markets. - Rey (2013, abstract) Large gross cross-border flows are moving in tandem across countries regardless of the exchange rate regime, they tend to rise in periods of low volatility and risk aversion and decrease in periods of high volatility and risk aversion, as measured by the VIX There is a global financial cycle. -Passari and Rey (2015, p 693) Rose: Quantifying Global Financial Cycle on Capital Flows 24
External Influences and the Blame Game Consider something important, driven by exogenous external effects Flight delays ( scheduled-actual arrival time) Linear models (with LARGE data sets) of flight delays often include: Flight distance Airline (carrier) effects Time Effects : Hour (both departure and arrival), Day, and Month Controls for conditions at both destination and arrival airports: Airport traffic (incoming/outgoing) Visibility Temperature Precipitation A typical such model has R2 << .2! But airlines often blame such forces for delays Rose: Quantifying Global Financial Cycle on Capital Flows 25
Country List Lithuania1 Luxembourg1 Macedonia Malta1 Mauritius Mexico4,5 Moldova Mongolia Namibia Netherlands1 New Zealand3 Thailand4 Turkey4,5 Uganda Ukraine UK2 USA2 Uruguay Venezuela Viet Nam Zambia 1: EMU Argentina Armenia Australia3,5 Austria1 Azerbaijan Bangladesh Belarus Belgium1 Bolivia Brazil4,5 Bulgaria Colombia Costa Rica Croatia Cyprus1 Czech Republic Denmark Ecuador Estonia1 Finland1 France1 Georgia Hungary Iceland3 Indonesia4,5 Ireland1 Israel Italy1 Japan2 Jordan Kazakhstan Korea4,5 Kyrgyzstan Paraguay Peru Philippines4 Poland4 Portugal1 Romania Russia4,5 Slovakia1 Slovenia1 South Africa4 Spain1 Germany1 Cabo Verde Laos Nicaragua Sri Lanka 2: Other Large Canada3,5 Greece1 Latvia1 Norway3 Suriname 3: Adv Factor Chile4 Sweden3 Honduras Lebanon Pakistan 4: EM Factor China4 Switzerland5 Hong Kong Panama Lesotho 5: Adv/EM Fac Rose: Quantifying Global Financial Cycle on Capital Flows 26
Quick Peek at Capital Flows and VIX: Little Capital Flows and the VIX Capital Flows, %GDP (y) against VIX (x); 63 small countries 1990Q1-2015Q4 FDI Inflows Debt Inflows Equity Inflows Credit Inflows Corr=.02 Corr=-.09 Corr=-.03 Corr=0.05 100 200 100 150 200 600 400 100 50 0 200 0 -200 -100 0 -100 0 -50 10 20 30 40 50 10 20 30 40 50 10 20 30 40 50 10 20 30 40 50 FDI Outflows Debt Outflows Equity Outflows Credit Outflows Corr=.01 Corr=-.05 Corr=-.00 Corr=-.06 100 100 200 300 200 200 400 600 100 50 0 0 0 0 -100 -50 -200 -100 10 20 30 40 50 10 20 30 40 50 10 20 30 40 50 10 20 30 40 50 Rose: Quantifying Global Financial Cycle on Capital Flows 27
(Interestingly) Dismal Factor Results If GFCy drives most variation in types/directions of capital flows, then 8 factors should be strongly related If VIX highly correlated with GFCy, it should also be correlated with factors BUT THEY RE NOT! Consider Advanced Economy Factors Most scatters are simply clouds VIX not linked to factors 3/8 correlations negative; all < .5 3/8 correlation coefficients significantly different from zero, 2 >0, 1 < 0 FDI inflows the strongest Insensitive results (robustness in paper) Rose: Quantifying Global Financial Cycle on Capital Flows 28
Capital Flow Factors and the VIX Capital Flow Factors and the VIX Dynamic factors (1 lag) 1990Q1-2015Q4, Advanced Economies Date 40 30 VIX 20 10 5 FDI inflows 0 -5 10 Debt inflows 5 0 1 Equity inflows 0 -1 2 Credit inflows 1 0 5 FDI 0 outflows -5 5 Debt outflows 0 -5 4 Equity outflows 2 0 -2 10 Credit outflows 5 0 1990q1 2008q3 10 20 30 40 -5 0 5 0 5 10 -1 0 1 0 1 2 -5 0 5 -5 0 5 -2 0 2 4 Rose: Quantifying Global Financial Cycle on Capital Flows 29
Factors of Advanced, Emerging Countries Typically very loose relationship Again, exception is FDI inflows Rose: Quantifying Global Financial Cycle on Capital Flows 30
Advanced and Emerging Economies Capital Inflow Factors: Advanced and Emerging Economies Dynamic factors 1990Q1-2015Q4, 1 lag Date 40 30 VIX 20 10 5 FDI 0 Advanced -5 10 5 FDI Emerging 0 -5 10 Debt 5 Advanced 0 2 Debt 0 Emerging -2 1 Equity Advanced 0 -1 1 Equity Emerging 0 -1 2 Credit Advanced 1 0 5 Credit Emerging 0 -5 1990q1 2008q3 10 20 30 40 -5 0 5 -5 0 5 10 0 5 10 -2 0 2 -1 0 1 -1 0 1 0 1 2 Rose: Quantifying Global Financial Cycle on Capital Flows 31
Price and Quantity Factors Prices and Quantity Factors Dynamic factors (1 lag) 1990Q1-2015Q4, Advanced Economies VIX 100 MAR 0 long-sample -100 100 MAR 0 short-sample -100 .2 MSCI stock return 0 -.2 -.4 5 FDI Inflows 0 -5 10 Debt Inflows 5 0 1 Equity Inflows 0 -1 2 Credit Inflows 1 0 10 20 30 40 -100 0 100 -100 0 100 -.4 -.2 0 .2 -5 0 5 0 5 10 -1 0 1 Rose: Quantifying Global Financial Cycle on Capital Flows 32
Price Factors and Fear Measures Also loose relationships Rose: Quantifying Global Financial Cycle on Capital Flows 33
Fear Measures and Asset Price Factors Fear Measures and Factors from Asset/Commodity Prices Dynamic factors 1990Q1-2015Q4, 1 lag Date 40 30 VIX 20 10 40 30 IVI, (British-VIX) 20 10 60 40 VDAX, (German-VIX) 20 0 100 MAR 0 long-sample -100 100 MAR 0 short-sample -100 .2 MSCI stock return, Advanced 0 -.2 -.4 .005 MSCI stock return, Emerging 0 -.005 10 Commodity price levels 5 0 -5 1990q1 2008q3 10 20 30 40 10 20 30 40 0 20 40 60 -100 0 100 -100 0 100 -.4 -.2 0 .2 -.005 0 .005 Rose: Quantifying Global Financial Cycle on Capital Flows 34
Capital Flow Panel Regressions Pool observations across countries Disaggregate by direction, type Start without any time-varying regressors, just time fixed effects Gives upper bound on all possible global phenomena (including GFCy) Estimate: CAPFLOWd,e,i,t = { i} + { t} + d,e,i,t Capital flows as % GDP, disaggregated by: Direction (d) in/out Type (e) FDI/equity/debt/credit Country (i) Quarter (t) Rose: Quantifying Global Financial Cycle on Capital Flows 35
Impact of Common Time-FE for Fit, Country FE Time Span 1990Q1-2015Q4 1996Q1-2015Q4 1990Q1-2015Q4 Country Span: All All Small R2 Measure: Within Overall Within Overall Within Overall Inflow FDI .06 .05 .06 .05 .08 .07 Inflow Portfolio Debt .10 .09 .10 .09 .07 .07 Inflow Portfolio Equity .05 .03 .05 .03 .11 .10 Inflow Credit .10 .09 .10 .09 .07 .06 Outflow FDI .08 .07 .08 .07 .08 .07 Outflow Portfolio Debt .07 .06 .07 .06 .09 .09 Outflow Portfolio Equity .08 .06 .08 .06 .07 .07 Outflow Credit .11 .11 .11 .11 .07 .06 Rose: Quantifying Global Financial Cycle on Capital Flows 36
Capital Flow Panel Regressions, results CAPFLOWd,e,i,t = { i} + { t} + d,e,i,t Fits poor for all directions/types of capital flow using within/overall R2 Insensitive to time sample/country size Global phenomena unimportant if impact on all countries identical Rose: Quantifying Global Financial Cycle on Capital Flows 37
But ... 2 big restrictions implicit 1. No explicit modelling of any economic/financial shocks (e.g., GFCy) 2. Assumed homogeneity of responses of all countries capital flows to common shocks Unpack these assumptions in two steps Rose: Quantifying Global Financial Cycle on Capital Flows 38
Model GFCy directly and indirectly Remove time FE, replace with 8 standard American push regressors a) VIX; b) real GDP growth rate; c) nominal policy rate; d) real policy rate; e) TED spread; f) yield curve slope; g) REER change; and h) M2 growth Add dynamic factors (match direction/type of capital flow to regressand) Attributes all commonality to GFCy Two factors: advanced, emerging market Include country FE But maintain common response (across countries) to 10 regressors: CAPFLOWd,e,i,t = jUSFUNDjt + kFACd,ekt + { i} + d,e,i,t Rose: Quantifying Global Financial Cycle on Capital Flows 39
Impact of 8 Fundamentals for Fit: Identical Responses, Country FE Within/Overall R2 MAR factors Lags of 8 US vars: None None Add 1 lag Add 4 lags Inflow FDI .05/.04 .07/.06 .05/.04 .06/.06 Inflow Portfolio Debt .04/.04 .05/.04 .05/.04 .06/.05 Inflow Portfolio Equity .05/.05 .05/.05 .06/.06 .08/.08 Inflow Credit .03/.03 .04/.04 .04/.04 .06/.06 Outflow FDI .03/.03 .04/.04 .03/.03 .05/.05 Outflow Portfolio Debt .05/.05 .06/.06 .05/.05 .07/.07 Outflow Portfolio Equity .01/.01 .01/.01 .02/.02 .05/.05 Outflow Credit .03/.03 .04/.03 .04/.03 .05/.04 Rose: Quantifying Global Financial Cycle on Capital Flows 40
Center-Country Variables explain little variation in capital flows But above maintains assumption that responsiveness identical across countries So, add country-specific effects of US variables (possibly at lag s) on capital flows: CAPFLOWd,e,i,t= ij,sUSFUNDjt-s + kFACd,ekt + { i} + d,e,i,t Rose: Quantifying Global Financial Cycle on Capital Flows 41
Country-Specific Responses to (up to 8) Fundamentals, Country FE Add country-specific interactions with: Within/Overall R2 Current VIX Current, 1 lag of VIX Current, 4 lags of VIX Current of 8 US vars Current, lag of 8 US vars Inflow Inflow Inflow Inflow Outflow Outflow Outflow Outflow FDI Portfolio Debt Portfolio Equity Credit FDI Portfolio Debt Portfolio Equity Credit .05/.05 .09/.02 .04/.02 .03/.00 .05/.01 .08/.00 .03/.03 .07/.02 .05/.04 .11/.02 .05/.03 .05/.00 .06/.01 .11/.00 .05/.02 .07/.02 .11/.02 .12/.01 .09/.05 .11/.00 .11/.02 .13/.01 .08/.00 .10/.03 .35/.08 .25/.00 .26/.07 .32/.00 .27/.01 .27/.02 .15/.00 .27/.02 .42/.08 .42/.05 .35/.11 .38/.00 .36/.01 .37/.04 .33/.13 .35/.01 Rose: Quantifying Global Financial Cycle on Capital Flows 42
Better, but not Good VIX alone does little, even when lags included Need 8 fundamentals (plus lags) Still fits poor ... all R2s << .5 Profligate parameterization: best fit is within R2 .42, but only 5.8 (=2016/349) observations per coefficient, overall R2 of .08! Rose: Quantifying Global Financial Cycle on Capital Flows 43
What About Extreme Events? Forbes and Warnock (2012) select extreme values of capital flows: Capital Flight (increased outflow) Retrenchment (decreased outflow) Stop (decreased inflow) Surge (increased inflow) also studied by Ghosh et al (2014) Rose: Quantifying Global Financial Cycle on Capital Flows 44
Forbes-Warnock events not explained by center-country phenomena Estimator, country effects Regressors Flight (Increased Outflow) Retrenchment (Decreased Outflow) Stop Surge (Increased Inflow) (Decreased Inflow) Probit, random Logit, fixed LS, fixed Probit, random Logit, fixed LS, fixed Time-Effects Time-Effects Time-Effects 8 US Variables 8 US Variables 8 US Variables .01 .07 .06 .01 .04 .03 .00 .17 .16 .00 .12 .12 .00 .21 .21 .00 .15 .16 .01 .12 .08 .01 .07 .04 Quasi R2 (probit/logit) or within R2 (LS). Panel estimates with country random/fixed effects as marked. 53 countries, 1990Q1-2009Q4. Rose: Quantifying Global Financial Cycle on Capital Flows 45
Domestic Credit Growth: like Capital Flows Just a peek at preliminary results; more on credit growth and asset prices to come (in separate paper) Rose: Quantifying Global Financial Cycle on Capital Flows 46
Domestic Credit Growth Fit of Country Time-Series Real Credit Growth Regressions Box-Plots of Adjusted/Raw R2s, Different Specifications/Samples Adjusted R2 R2 Default Default All 26 years All 26 years No factors No factors Only factors Only factors Static factors Static factors MAR factors MAR factors Add fund lag Add fund lag 4 VIX lags 4 VIX lags Drop >|10%| Drop >|10%| Drop outliers Drop outliers No advanced No advanced 1996-2015 1996-2015 High K mob'y High K mob'y Drop poor Drop poor Fixed ER Fixed ER Flexible ER Flexible ER 0 .25 .5 .75 1 0 .25 .5 .75 1 Default: 8 US vars, Adv + EM 26-yr dynamic factors, intercept; small countries 1990Q1-2015Q4, 10 obs min Rose: Quantifying Global Financial Cycle on Capital Flows 47
Suppose GFCy only Relevant during Crises? Little suggestion in literature, but ... Focus on events when VIX high 8 occasions when VIX closes above 30 6 year event study Means with empirical (5,95) confidence intervals Little evidence of significant shifts around crisis periods Results insensitive to exact definition of crises (see paper) Rose: Quantifying Global Financial Cycle on Capital Flows 48
Event Study (8 events) Capital Flows (%GDP) around quarters when VIX close>30 FDI Inflows Debt Inflows Equity Inflows Credit Inflows 20 10 10 15 20 4 10 5 2 5 0 0 0 0 -10 -2 -5 -5 -12 0 12 -12 0 12 -12 0 12 -12 0 12 FDI Outflows Debt Outflows Equity Outflows Credit Outflows 15 10 10 15 8 6 10 5 4 5 5 2 0 0 0 0 -5 -2 -10 -5 -5 -12 0 12 -12 0 12 -12 0 12 -12 0 12 Means with (5,95) confidence interval. 1990Q1-2015Q4 data, 63 small countries. Rose: Quantifying Global Financial Cycle on Capital Flows 49
Robustness: US$, not VIX (7 events) Capital Flows (%GDP) around US$ Appreciations US REER rises>3.5%, 7 events FDI Inflows Debt Inflows Equity Inflows Credit Inflows 10 15 20 25 15 10 15 4 10 2 5 5 0 0 5 0 -5 0 -10 -5 -2 -12 0 12 -12 0 12 -12 0 12 -12 0 12 FDI Outflows Debt Outflows Equity Outflows Credit Outflows 15 10 20 6 10 4 10 5 5 2 0 0 0 0 -2 -10 -5 -5 -12 0 12 -12 0 12 -12 0 12 -12 0 12 Means with (5,95) confidence interval. 1990Q1-2015Q4 data, 63 small countries. Rose: Quantifying Global Financial Cycle on Capital Flows 50


")


 Capital Flow Equations")
 Capital Flow Equations, continued")


 Dismal Factor Results")


")


")
")