Understanding Global Imbalances and Chinese Savings
This content discusses the importance of understanding global imbalances and Chinese savings, analyzing data on current account balances, national income accounting, international exchanges, and balance of payments. It covers the concept of global imbalances, the ways in which national income is spent, and the relationship between savings, exports, imports, and capital flows. The content also touches upon the implications of current account balances, private capital accounts, and official reserve settlements. Overall, it provides insights into the interconnectedness of economies on a global scale.
- Global Imbalances
- Chinese Savings
- National Income Accounting
- Balance of Payments
- International Exchanges

Download Presentation

Please find below an Image/Link to download the presentation.
The content on the website is provided AS IS for your information and personal use only. It may not be sold, licensed, or shared on other websites without obtaining consent from the author. Download presentation by click this link. If you encounter any issues during the download, it is possible that the publisher has removed the file from their server.
E N D
Presentation Transcript
Should Everyone in the World Care About Chinese Savings? Understanding Global Imbalances Andrew K Rose NUS-Business
Setting the Stage 1: Global Imbalances Understanding the theory and data of global imbalances Rose: Chinese Savings 2
National Income Accounting Recall: Aggregate Output is Spent in four ways: 1. Consumption of goods and services by Households ( 60%) 2. Investment in capital and structures by Firms ( 20%) Also depreciation, R&D, change in inventories 3. Public Consumption (health, education, infrastructure, defense) done directly by Government ( 20%) Excludes indirect (large) transfers to old, unemployed, poor, bond-holders, 4. Net Exports ( 0%) Y C + I + G + (X-M) Andrew Rose, Global Macroeconomics 2 3
Accounting for International Exchanges Y = C + I + G + (X-M) implies [Y (C + G)] - I = S I = X M National Saving is defined as S [Y (C + G)] The output that isn t spent by either the private or public sectors (X - M) Net Exports (NX); trade of goods, services (S - I) Net Capital Flows, public and private Andrew Rose, Global Macroeconomics 6 4
Balance of Payments Current Account + (Private) Capital Account + Official Reserve Settlements = 0 Algebraically c/acc + k/acc + ORS = 0 Current Account: net sales of goods and services (basically NX or X-M) Capital Account [sometimes Financial Account ]: net sales of privately-held assets (debt, equity, real estate) ORS: net sales of public assets (money for foreign exchange intervention) Works at any level of aggregation (including individual) Andrew Rose, Global Macroeconomics 6 5
Global Imbalances in Data (WEO, 10/2019) WORLD ECONOMIC OUTLOOK: GLOBAL MANUFACTURING DOWNTURN, RISING TRADE BARRIERS Table A10. Summary of Current Account Balances (Billions of US dollars) Projections 2020 252.2 569.1 368.9 261.0 13.7 58.8 15.0 180.5 99.6 30.2 326.4 134.8 2011 38.7 445.7 12.4 232.9 24.6 68.3 47.4 129.8 51.6 49.6 264.6 376.6 2012 25.3 426.8 173.5 251.6 25.9 7.0 3.1 59.7 100.9 65.7 274.1 343.2 2013 203.9 348.8 300.7 244.7 14.3 21.0 20.7 45.9 141.9 59.3 342.1 170.1 2014 225.4 365.2 340.4 280.0 27.3 41.1 14.9 36.8 149.6 43.2 357.2 173.0 2015 269.7 407.8 313.1 288.4 9.0 24.6 13.9 136.4 142.4 55.2 359.8 60.3 2016 337.7 428.3 370.3 293.8 11.5 47.5 27.9 197.9 139.3 48.9 343.1 81.3 2017 411.5 439.6 409.7 295.8 18.7 50.7 24.3 202.0 88.1 46.3 328.5 12.6 2018 362.3 491.0 396.6 289.5 16.2 52.0 13.2 175.3 109.1 45.2 359.2 1.9 2019 304.9 539.5 376.6 269.1 13.7 57.0 12.8 172.1 94.7 32.5 349.6 14.4 2024 261.4 586.5 344.1 270.3 14.2 46.4 17.6 228.6 115.4 36.4 339.2 383.2 Advanced Economies United States Euro Area Germany France Italy Spain Japan United Kingdom Canada Other Advanced Economies1 Emerging Market and Developing Economies Regional Groups Emerging and Developing Asia Emerging and Developing Europe Latin America and the Caribbean Middle East and Central Asia Sub-Saharan Africa Analytical Groups By Source of Export Earnings Fuel Nonfuel Of Which, Primary Products By External Financing Source Net Debtor Economies Net Debtor Economies by Debt-Servicing Experience Economies with Arrears and/or Rescheduling during 2014 18 Memorandum World European Union Low-Income Developing Countries Middle East and North Africa 98.0 38.7 110.2 436.1 8.6 120.6 27.7 146.5 423.3 26.6 98.8 63.3 169.4 340.4 36.4 229.3 12.7 183.2 202.5 62.9 309.4 30.9 170.5 137.3 92.7 226.9 14.4 97.7 139.9 56.3 175.2 23.7 78.8 23.9 36.2 20.1 63.7 99.2 101.4 43.8 82.6 60.4 80.9 14.9 61.6 47.6 23.2 81.9 54.7 69.0 70.2 7.4 122.6 107.8 75.2 619.8 243.1 28.1 596.2 253.0 61.3 465.1 295.0 83.2 311.2 138.2 53.8 76.3 16.0 66.1 73.7 7.6 41.4 84.9 72.3 57.4 297.9 296.0 72.7 145.5 159.9 51.4 68.7 203.5 49.9 16.5 399.7 65.2 327.8 407.3 381.9 349.9 318.7 226.1 241.9 291.8 292.4 332.2 463.1 18.3 34.7 39.4 33.4 52.2 49.4 35.4 24.1 33.9 40.3 41.9 338.0 75.2 21.8 405.2 368.5 206.3 31.1 413.0 374.0 277.2 37.1 333.5 398.4 288.7 41.5 193.7 209.4 282.8 74.6 120.3 256.3 323.2 37.4 116.9 424.1 412.6 33.2 4.4 364.2 383.9 52.9 118.3 290.5 372.6 66.6 2.8 117.4 358.4 74.9 41.2 121.9 319.2 81.1 88.6 Rose: Chinese Savings 6
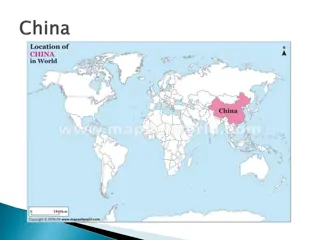
Setting the Stage 2: Chinese Growth Key features of Chinese growth Rose: Chinese Savings 7
Chinese GDP has grown fast for a long time Rose: Chinese Savings 8
Chinese Growth: Unusually Persistent & High https://www.gapminder.org/tools/#$state$time$value=2019;&entities $show$country$/$in@=usa&=rus&=chn&=nga&=jpn&=gbr&=bra;;;;;&c hart-type=linechart Rose: Chinese Savings 9
Why is Chinese Growth Persistent and High? Consensus that growth must be understood from supply side, emphasizing production Output (Y) is produced by combining: Capital (K) Labor (L) in a Production function F(.) linking inputs to output So Y = F(K,L) Growth must come from F, K, or L Rose: Chinese Savings 10
Some Good and Bad Reasons for High Growth Implausible Explanations K: High Savings (leads to high levels of income, not high growth rates) Lots of capital leads to lots of depreciation, inefficiently used capital F: Good institutions (openness to trade, rule of law, low corruption) Again, usually high levels of income, but not high growth rates Plausible, Widely Accepted Explanations L: High growth in labor force Either high (lagged) fertility or growth in population s participation in labor force F: High growth in productivity (not one-time boosts) Either because country innovating at leading edge, or Poor country catching up and importing existing ideas/techniques Rose: Chinese Savings 11
Savings is not (strongly) associated with higher growth https://www.gapminder.org/tools/#$state$time$value=2018;&marker$axis_ x$which=gdp_per_capita_yearly_growth&domainMin:null&domainMax:null &zoomedMin:null&zoomedMax:null&scaleType=linear&spaceRef:null;&axis_ y$data=data_wdi&which=ny_gns_ictr_zs&domainMin:null&domainMax:null &zoomedMin:null&zoomedMax:null&spaceRef:null;;;&chart-type=bubbles But it is (somewhat) with higher levels of income https://www.gapminder.org/tools/#$state$time$value=2018;&marker$axis_ x$which=gnipercapita_constant_2010_us&domainMin:null&domainMax:nul l&zoomedMin:null&zoomedMax:null&scaleType=genericLog&spaceRef:null; &axis_y$data=data_wdi&which=ny_gns_ictr_zs&domainMin:null&domainM ax:null&zoomedMin:null&zoomedMax:null&spaceRef:null;;;&chart- type=bubbles Rose: Chinese Savings 12
Clearer in the Cross-Sectional Data Rose: Chinese Savings 13
Tangent: World Bank Institutions Measures, 2018 Control of Corruption 1.87351 -0.27124 1.31689 1.94658 1.67644 -0.18629 -0.25155 0.235619 1.42477 2.17452 1.82658 1.32322 -0.218289 Government Effectiveness 1.71611 0.477128 1.48053 1.61963 1.90361 0.283049 0.179875 0.413884 1.67582 2.23147 1.34188 1.577 -.108963 Political Stability, Absence of Violence Regulatory Quality 0.991189 -0.26106 0.109135 0.604895 0.794365 -0.95652 -0.53344 0.311193 1.05969 1.51034 0.048717 0.477461 -.208934 Voice and Accountability 1.52086 -1.44938 1.17941 1.42236 0.468593 0.378833 0.179737 1.04552 1.02264 -0.05911 1.38398 1.03933 -1.38408 Rule of Law 1.77079 -0.20158 1.44009 1.63045 1.7714 0.026216 -0.31492 0.246762 1.53411 1.84489 1.63864 1.45326 -.527161 Canada China France Germany Hong Kong SAR India Indonesia Italy Japan Singapore United Kingdom United States China, 2000 1.66529 -0.13502 1.17306 1.74925 2.206 -0.18365 -0.07127 0.671495 1.32921 2.13157 1.76186 1.57799 -.33929 Rose: Chinese Savings 14
Conventional Reasons for Growth 1. Initial conditions Poorer countries growth faster as they catch up works! 2. Institutions Private sector needs stability, protection from diversion doesn t work! 3. Labor Force Growth Chinese fertility low, though much underemployed labor perhaps temporarily. 4. Innovation, productivity growth Fact: China has grown faster for a longer period than any other country Why is China special/different? Rose: Chinese Savings 15
Fact: China invests a lot Rose: Chinese Savings 16
More interesting: China saves a lot Rose: Chinese Savings 17
China exports goods and savings on net Rose: Chinese Savings 18
Linking Global Imbalances & Chinese Growth Bretton Woods Revived Comprehensive theory of international financial system developed by Deutsche Bank (Dooley, Garber, and Folkerts-Landau) Initially focused mostly on understanding Chinese development strategy Explains many features of capital flows, growth, international reserve accumulation, exports, and so forth Rose: Chinese Savings 19
Underlying Motivation Chinese Communist Party retains monopoly on political power in return for continued fast growth 1989: Necessary to integrate China into modern industrial global economy, take advantage of under-employed rural labor But under-developed financial system (the brain of a modern economy) Rose: Chinese Savings 20
Key Idea 1: Exchange Rate Management Fix under-valued (US$) exchange rate to generate competitiveness Leads to growth in exports, employment, modernization But the balance of payments must balance China dislikes capital mobility, only gradual loosening of restrictions Maintain peg/under-valuation via FX intervention Hence massive international reserve accumulation Rose: Chinese Savings 21
Recall: Balance of Payments Recall c/acc + k/acc + ORS = 0 Current Account: net sales of goods and services (basically NX or X-M) For China: high and positive Capital Account [sometimes Financial Account ]: net sales of privately-held assets (debt, equity, real estate) For China: very small (capital controls) ORS: net sales of public assets (money for foreign exchange intervention) For China: high and negative Succinctly: China sold America manufacturing goods to purchase (import) US treasuries Andrew Rose, Global Macroeconomics 6 22
Chinas competitiveness means that China exports grew a lot Rose: Chinese Savings 23
RMB FX Rate: Steady (then appreciation) Rose: Chinese Savings 24
Chinese International Reserves Rose (to maintain the fix) Rose: Chinese Savings 25
Fixed Exchange Rate Regime The Authorities : Governmentchooses to fix exchange rate (or not); Central Bank enacts policy Fix: Authorities promise to use international reserves to take either side of any FX transaction in any size at fixed exchange rate (or within bands) Hence fix may affect international reserves But international reserves are a key part of the monetary base Thus foreign exchange policy affects the money supply and monetary policy Andrew Rose, Global Macroeconomics 10 26
What is a Fixed Exchange Rate? Fixed Exchange Rate Regime authorities take either side of FX transaction in unlimited quantity Almost always, the nominal (market) exchange rate is fixed But if prices are sticky, the real exchange rate (adjusted for prices) is also fixed, at least in short run Real exchange rate: standard measure of competitiveness Andrew Rose, Global Macroeconomics 10 27
Which Countries Fix Exchange Rates? Countries usually fix nominal, bilateral rate to either US$ or Euro Mostly small countries currently US$ Aruba, Bahamas, Barbados, Belize, Ecuador, El Salvador, Panama, Eastern Caribbeans (formerly Argentina, Brazil, Mexico, Russia, ) HK (formerly China, Indonesia, Korea, Malaysia, Philippines, Thailand ) Jordan, Oman, Qatar, Saudi Arabia, UAE Euro Bulgaria, Bosnia, Kosovo, Montenegro (formerly Sweden, UK, ) Central and Western Africans Others Brunei (Singapore) Rose: Chinese Savings 28
Data from IMFs Annual Report on Exchange Arrangements and Exchange Restrictions ANNUAL REPORT ON EXCHANGE ARRANGEMENTS AND EXCHANGE RESTRICTIONS 2018 Exchange rate arrangement Monetary Policy Framework Exchange rate anchor Monetary aggregate target (24) Inflation- targeting framework (41) (Number of countries) No separate legal tender (13) US dollar (38) Euro (25) Composite (9) Other (9) Kiribati Nauru Tuvalu Other1 (46) Palau Panama Timor-Leste Kosovo Montenegro Ecuador El Salvador Marshall Islands Micronesia Djibouti Hong Kong SAR ECCU Antigua and Barbuda Dominica Grenada Aruba The Bahamas Bahrain Barbados Belize Cura ao and Sint Maarten Eritrea San Marino Currency board (11) St. Kitts and Nevis St. Lucia St. Vincent and the Grenadines Bosnia and Herzegovina Bulgaria Brunei Darussalam Conventional peg (43) CEMAC Cameroon Central African Rep. Chad Rep. of Congo Equatorial Guinea Gabon Iraq Jordan Oman Qatar Saudi Arabia Turkmenistan United Arab Emirates Cabo Verde Comoros Denmark2 S o Tom and Pr ncipe WAEMU Benin Burkina Faso C te d Ivoire Guinea Bissau Mali Niger Senegal Togo Fiji Kuwait Morocco3 Libya Bhutan Eswatini Lesotho Namibia Nepal Solomon Islands4 Samoa4 Rose: Chinese Savings 29
Economies choose their exchange rate regime Currently: 13% choose hard pegs (Bulgaria, HK, Panama) 45% choose soft pegs (China, Indonesia, Nicaragua, Singapore) Remainder float (Canada, Chile, EMU, India, Japan, UK, US) But exchange rate regimes can switch! Rose: Chinese Savings 30
Key Idea 2: Chinese Private Capital Flows Recall c/acc + k/acc + ORS = 0 Capital Account: net sales of privately-held assets (debt, equity, real estate) China dislikes free international private flow of capital Rose: Chinese Savings 31
Countries with Capital Mobility Capital can flow freely without (serious) restrictions between the small open (e.g., HK/Singapore/Canada/Denmark) economy and large ( center or anchor ) neighbor(US/EMU) Domestic & foreign bonds become perfect substitutes, similar in liquidity, maturity, taxes, risk Can also easily add country risk premium How to measure restrictions to private capital flows? Prices vs quantities Continuing mystery of international finance, Home Bias : most investors hold too many assets issued close to home. Andrew Rose, Global Macroeconomics 10 32
IMF 2019 Annual Report on Exchange Arrangements and Exchange Restrictions Rose: Chinese Savings 33
Zooming in on China Central African Republic China, People s Rep. of Congo, Dem. Rep. of Dominican Republic Congo, Republic of Czech Republic C te d Ivoire Costa Rica Colombia Dominica Denmark Comoros Djibouti Croatia Cyprus Chad Chile Capital Transactions On capital market securities On money market instruments On collective investment securities Controls on derivatives and other instruments Commercial credits Financial credits Guarantees, sureties, and financial backup facilities Controls on direct investment Controls on liquidation of direct investment Controls on real estate transactions Controls on personal capital transactions Provisions specific to: Commercial banks and other credit institutions Institutional investors Rose: Chinese Savings 34
Key Idea 3: Chinese Public Capital Flows Chinese (public-sector) capital flows to US (China holds US treasuries) These treasuries act as collateral for foreign FDI in China FDI key to guide development of modern economy (foreigners gain from Chinese growth) Result: high foreign (and domestic) investment, higher savings, high export growth, high employment and growth Also: capital flows from poor (China) to rich (US) Rose: Chinese Savings 35
Key Idea 4: Mundells Trilemma, or Incompatible/Holy Trinity The following are individually desirable but mutually incompatible: 1. Independent national monetary policy ( Monetary Sovereignty ) 2. Perfect capital mobility 3. Fixed/stable exchange rates Different countries make different sacrifices and choices also change over time China (and many developing countries) sacrifice capital mobility Fixers (HK, Denmark, EMU members) sacrifice independent monetary policy Most rich countries (US, Japan, UK, Sweden) sacrifice exchange rate stability Andrew Rose, Global Macroeconomics 10 36
Testable Predictions Massive Chinese investment, export growth, current account surplus, reserve accumulation Capital flows uphill from poor to rich! Control Chinese inflation via capital controls, financial repression Key to maintain high Chinese savings Global imbalances sustainable for how long? Real interest rates depressed in West by Chinese savings Low returns might have encouraged financial bubbles But system didn t seem to end with 2007-9 financial crisis Rose: Chinese Savings 37
Special Role of US US traditionally tolerates current account deficits without protectionism (unlike Europe) Recent change, manifest in Trump s election Hence China must fix exchange rate against US$ (most popular choice) Intervention means China purchases US$ US Treasuries provides best collateral for FDI Rose: Chinese Savings 38
Eventually But China s place in this is only temporary! As under-employed Chinese labor transferred to modern economy/cities, wages rise, China modernizes, eventually system ends Exchange rate appreciates, capital controls lifted, export growth slows, consumption rises, smooth transition to modern economy But system may continue if other countries (India? Indonesia?) replace China Rose: Chinese Savings 39
System Ending for China? 30% real RMB appreciation since 2007, declining current account surplus Financial market reforms Gradual opening of capital account, end financial repression, regular shadow banking Other recent reforms Growing role for consumption (e.g., sale of rural land rights creates wealth) Growing internal labor mobility may continue system for years, especially given poor demographics Rose: Chinese Savings 40
More Recently Much evidence of slowing Chinese growth Stock market bubble collapses in summer 2015 RMB has sometimes seemed over-valued in recent years; PBoC intervening, international reserves sometimes falling Beginning of switch in focus to India, Indonesia, Vietnam, others? Export surge has triggered America protectionism, trade war Rose: Chinese Savings 41
Sources of (Key) Chinese Savings Not government or corporate; households save more Shrinking public healthcare/education weak social safety net Less spending on young (low fertility), less support for old (few kids, pensions), ageing population Financial repression; can t borrow/smooth Sex imbalance Rising inequality (rich save more) and uncertainty And recall high savings may have contributed to growth, but are foregone consumption Rose: Chinese Savings 42
China grows but consumes little (flip side) Rose: Chinese Savings 43
Why should you care about Chinese Savings? If you re Chinese Indicator of internal Chinese weaknesses Reasons why Chinese savings are high Foregone Chinese welfare High savings = low consumption But perhaps one of the reasons for high growth If you re not Foreign disruption Exports from China = Imports from China Good for (many) foreign consumers; worse for (few) foreign producers Harbinger of foreign policy? Rose: Chinese Savings 44
Key Takeaways Measurability Sources of Growth Facts on Chinese growth, income Balance of Payments Global Imbalances Private and Public Capital Mobility and Flows Fixed Exchange rates Mundell s Trilemma/Incompatible Trinity Bretton Woods Revived Rose: Chinese Savings 45


")


 associated with")


")


 Chinese Savings")
")