Evolution of Locally Managed Marine Areas in the South Pacific Island Region
This content discusses the status, potential, and objectives of Locally Managed Marine Areas (LMMAs) in the South Pacific Island Region, highlighting the evolution from traditional purposes to modern conservation and fisheries management practices. It also provides insights into the inventory of Marine Managed Areas in Pacific countries, emphasizing the importance of community-driven initiatives for marine resource sustainability.

Download Presentation

Please find below an Image/Link to download the presentation.
The content on the website is provided AS IS for your information and personal use only. It may not be sold, licensed, or shared on other websites without obtaining consent from the author. Download presentation by click this link. If you encounter any issues during the download, it is possible that the publisher has removed the file from their server.
E N D
Presentation Transcript
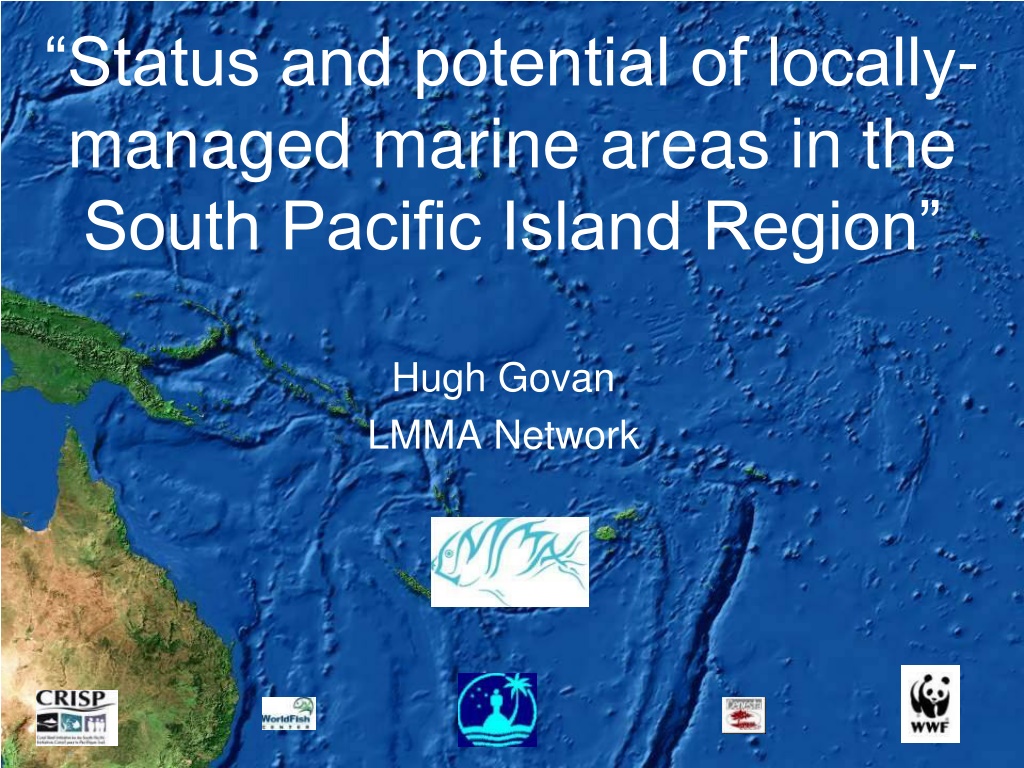
Status and potential of locally- managed marine areas in the South Pacific Island Region Hugh Govan LMMA Network
Content Based on SPREP/WWF review of regional progress and LMMA annual reports Overview of history and status Characteristics Lessons and challenges Potential for CEAFM or EBM
Evolution of LMMAs and objectives Traditional purposes / food allocation Conservation Fisheries management / Livelihoods Biodiversity Pre- 1900s Ceremonial or Kastom purposes (Vanuatu, Fiji ) Support agencies (up to 1990s) Harvest tabu area when fish are plentiful (Vanuatu) To protect the nesting ground and rookery of the Hawksbill and other sea turtles in the Arnavon Islands. (AMCA) Support agencies (since 1990s) To manage and protect the inshore area to help increase the amount of resources (Tonga) Locally Managed Marine Areas
S P E C T R U M OF O B J E C T I V E S Traditional purposes / food allocation Conservation Local or internal Global or external Fisheries management / Livelihoods Biodiversity Ceremonial or Kastom purposes (Vanuatu, Fiji ) Support agencies (up to 1990s) Harvest tabu area when fish are plentiful (Vanuatu) To protect the nesting ground and rookery of the Hawksbill and other sea turtles in the Arnavon Islands. (AMCA) Support agencies (since 1990s) To manage and protect the inshore area to help increase the amount of resources (Tonga) Locally Managed Marine Areas
Inventory of Marine Managed Areas in Pacific Countries EEZ Area (km ) Territorial Waters (TW) (km ) Number of active MMAs / tabus Active MMA coverage (km ) % of EEZ under management % of TW under management Cook Islands Fiji Papua New Guinea 24 217 0.001 0.8 0.06 9.5 1,830,000 1,290,000 31,314 114,464 19 10,880 86 0.002 0.02 3,120,000 355,699 59 Samoa Solomon Islands 54 0.2 2.1 120,000 9,995 209 113 0.07 0.7 1,340,000 140,038 941 Tonga Tuvalu Vanuatu Marshall Islands 6 4 0.01 0.008 0.01 0.2 0.4 0.1 700,000 900,000 680,000 37,526 18,975 69,169 93 76 89 20 1 0.03 0.7 2,131,000 106,994 701 Kiribati Federated States of Micronesia 14 0.08 4 3,600,000 75,300 3,054* 12 0.0008 0.05 2,980,000 49,992 23 Palau 28 0.2 8 601,000 14,007 1,126 0.09 1.7 19,292,000 1,023,473 579 17,270 TOTAL *This estimation excludes the Phoenix Island Protected Area that comprises 408,250 km making 11% of the EEZ under management once the management plan and endowment will be finalized.
Inventory of Marine Managed Areas in Pacific Territories EEZ Area (km ) Territorial Waters (TW) (km ) Number of MMAs Active MMA coverage % of EEZ under management % of TW under management American Samoa 19 0.04 1.8 390,000 9,910 174 French Polynesia 10 0.06 1.2 5,030,000 243,885 2,837 New Caledonia 20 0.9 23 1,740,000 68,865 16,188* Niue 3 3 0.008 0.0003 1 390,000 2,983 31 Tokelau 0.01 290,000 6,999 1 Wallis and Futuna 0 0 0 300,000 5,686 0 Guam 11 0.08 3.7 218,000 4,575 170 Northern Marianas 8 0.0007 0.05 1,823.000 27,217 13 0.2 5.2 TOTAL 10,181,000 370,120 74 19,414 * Including World Heritage core marine areas declared in 2008 comprising 15,743 km and excluding the buffer zone of 12,871 km .
What are these marine managed areas like? Roviana, Solomon Islands
Most are community conserved areas or LMMAS Fishing reserve (tabu), Solomon Islands Community planning, Tuvalu Sa - (No-take zones) in Safata MPA, Samoa Traditional declaration of a tabu in Vanuatu (with pig killing)
Many are performing adaptive management in which communities identify problems, examine options, implement actions and evaluate
The same adaptive management process can be use for integrated management, disaster preparedness, adaptation and other community development purposes Paunagisu, Marou and Anelgehaut in Vanuatu have watershed and development plans integrated in their MPA plan
No-take zones or tabus are small What are the sizes of tabu? (n=78) e.g. Solomon Islands 30 27 25 25 20 15 15 10 6 5 2 1 1 1 0 200-50 50-25 25-10 10-5 5-1 1-0.5 0.5-0.1 0.1 > Km2 and the tabus may be periodically opened.
Importance of social networks Traditional ties and neighbouring communities (trickle down) Government sponsored e.g. Fisheries or Environment department in Samoa Provincial or district (e.g. Kadavu, GERUSA) National multi-stakeholder e.g. FLMMA, SILMMA, PNG-LMMA Regional NGOs e.g. WWF, TNC, FSPI Regional mixed e.g. LMMA network, PIMPAC, MIC
The Locally Managed Marine Area Network (LMMA)
LMMA Network Members LMMA Country Networks Philippines Philippines PLMMA Palau Palau FSM ILMMA PNGCLMA Solomon Islands SILMMA Indonesia Indonesia Papua New Guinea Papua New Guinea Vanuatu Fiji Islands Fiji Islands FLMMA
Site members of the LMMA Network 2009 # of # of Total Total No. of No. of LMMAs LMMAs No. of No. of Tools/ Tools/ MPAs MPAs LMMA LMMA Area Area (sq km) (sq km) Tool/MP Tool/MP A Area A Area (sq. km) (sq. km) No. of No. of Villages Villages Manage Manage- - ment ment Plans Plans 208 Legally Legally Gazetted Gazetted Country Country Fiji 250 388 235 10,74 5 696.9 8 n/a 64 512.73 467 1 Indonesia 16 11 16 34 16 8 Palau Pohnpei Papua New Guinea Philippines Solomon Islands Vanuatu Totals Totals 5 7 12 11 4 14 7 7 37 221.23 15 512.73 1 7 9 5 7 4 30 74 36 148 30 125 166 249 14 151 30 60 0 0 26 420 420 27 639 639 18 475 475 290 12,725 12,725 1 5 1 1,416 1,416 336 336 26 26
Kadavu Yaubula Management Support Team A. Tawake
Kadavu Yaubula Management Support Team A. Tawake
What are some of the reported benefits? Biodiversity (increases in tabu areas) Increased resource harvests (harder to measure) Information, awareness and capacity Food security predictable supply Governance and conflict management Community organization Resilience and adaptation Health Strengthen resource rights, respect, tenure Cultural recovery/survival Integrated resource management An excellent basis for Integrated Island Management / ICZM?? Biodiversity (increases in tabu areas) Increased resource harvests (harder to measure)
Some key issues Define new roles: Government/external agencies role is support, coordination and technical advice rather than command and control define new governance roles and multi-sector partnerships. NGOs..? Go to scale and beyond MPAs: Huge potential of tenure systems for integrated or ecosystem based management owing to land and sea tenure building block of resource management Long term sustainability: External costs kept very low as community provides main inputs beware incentives sustainable use is the key driver The potential is very good AND little alternative approaches demonstrated
Support costs can be low (yearly avg) Cost/km2 Cost/km2 No TakeZone Country Site/project Cost/site Village Fisheries Management Programme (VFMP) Samoa 1,344 1,862 5,795 Aleipata MPA Samoa 6,500 - 16,000 179 - 360 2,339 8,394 Cost effectiveness? Safata MPA Samoa 6,500 - 19,000 179 - 534 2,339 4,471 WFC, Isabel and Western Province Solomon Islands 3,000 ~100 3,500 WWF, Western Province Solomon Islands 16,000/MPA 5,000/NTZ 2,900 FSPI, Malaita, Gela, Guadalcanal Solomon Islands 1,851 - 2,569 4,634 - 6,432 TNC, Arnavon Islands Solomon Islands 20,000 125 125 FSPV Vanuatu 5,537 2,187 WWF Cook Islands 5,000-10,000 15,000-30,000 Daku Fiji 478 81 166 Nasau Fiji 938 158 171 Navakavu Fiji 725 39 247 170 IAS FLMMA sites Fiji 800 14.6 265.8 Waitabu Fiji 3,000 12,000 CFMDP, Morobe and Kavieng PNG 3,800
Major costs are staff and transport e.g. FSPI Solomon Islands National network support Government support Personnel External Technical support Communications Office/field equipment and admin Travel Workshops/Training
Potential for taking these experiences forward as a national approach would depend on being: Designed to fully integrate into government functions over the medium term (applies to Melanesia), Decentralized into logistically functional management areas (provinces or similar), Cost effectiveness to improve the likelihood of sustainable financing within government budgets or from donors / all of government approach (DRM, CCA, ICM) Phased or cumulative approach optimizing trickle down or snowballing effects. 1000 s of communities.. Simple but strategic overview and non-burdensome data collection to enable the ongoing identification of gaps (objectives, species, habitats, coverage and so on).
Sources and reference: Govan et al*. 2009. Status and potential of locally-managed marine areas in the Pacific Island Region. SPREP/WWF/ Reefbase/CRISP LMMA annual reports www.lmmanetwork.org * Et al. = Contributions from Alifereti Tawake, Kesaia Tabunakawai, Aaron Jenkins, Antoine Lasgorceix, Ann-Maree Schwarz, Bill Aalbersberg, Bruno Manele, Caroline Vieux, Dan Afzal, Delvene Notere, Erika Techera, Eroni Tulala Rasalato, Helen Sykes, Hugh Walton, Hugo Tafea, Isoa Korovulavula, James Comley, Jeff Kinch, Jess Feehely, Julie Petit, Louise Heaps, Paul Anderson, Pip Cohen, Pulea Ifopo, Ron Vave, Roy Hills, Seini Tawakelevu, Semese Alefaio, Semese Meo, Shauna Troniak, Suzie Kukuian, Sylvia George, Tevi Maltali. Munda, Solomon Islands


")