Understanding Key Performance Indicators (KPIs) and Dashboards for Improved Performance
Key Performance Indicators (KPIs) play a vital role in assessing organizational performance across various areas. This content emphasizes the importance of measuring outcomes, monitoring uptime and downtime, and examples of KPIs in equipment management. It also provides insights on creating KPI dashboards, collecting daily data for analysis, and calculating downtime percentages. Start your journey to better performance by learning how to utilize KPIs effectively.

Download Presentation

Please find below an Image/Link to download the presentation.
The content on the website is provided AS IS for your information and personal use only. It may not be sold, licensed, or shared on other websites without obtaining consent from the author. Download presentation by click this link. If you encounter any issues during the download, it is possible that the publisher has removed the file from their server.
E N D
Presentation Transcript
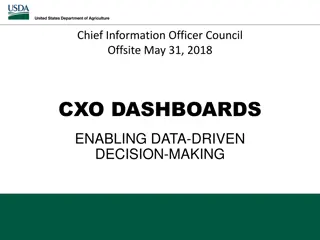
KEY PERFORMANCE INDICATORS (KPI) OUTCOME
IF YOU CANT MEASURE IT YOU CAN T IMPROVE IT
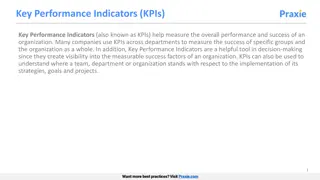
KPIs, Dashboards KPI is a specific measure of a Organization's (Lab s) performance in any area of its functioning. At the facility level: It is a mechanism to understand the bottlenecks and improve As a bridge: It is a mechanism of transmitting the data from the facility to the higher/highest management At the management level: enablement of decisions, policies.
Examples for KPI in Equipment Management 1. Downtime: Mandatory (NHM Operational guidelines) 2. Preventive Maintenance Programs 3. Calibration Status 4. Decontamination Programs 5. Quality Assurance Programs 6. Availability of Tech Support 7. Availability of spare parts Whatever is your bottleneck ..Check the checklist at the end of the module and decide ..
A KPI Dashboard example.. 25 Mar-16 20 Apr-16 15 May-16 Jun-16 10 Jul-16 Aug-16 5 Sep-16 0 Oct-16 Downtime No Preventive Maintenance Non calibrated equip No Adverse Incidents decontamination
Daily: Collect data S. No/ Date/Reported by Type of NCE/Incident** Immediate Action Corrective Action Preventive Action Root Cause Analysis Time taken for resolution
At the end of the month: Calculate % Downtime Equipment Days: total number of equipment selected (n) x 30 = 30n Downtime day: One working day when the equipment was down. % Downtime = Downtime days/Equipment Days x100 To be monitored monthly *The learner is referred to QI monitoring tool on this site
The Monthly Dashboard: An example Put hyperlink to excel