Spatial Interpretation of Socio-Economic Information in Urban Area
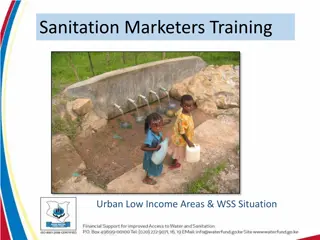
The project focuses on analyzing socio-economic data in Mymensingh Municipality from 2011 to 2031. It includes field verification findings, spatial interpretation results, maps/figures representing family and settlement types, and considerations for urban planning. The presentation outlines basic information, such as surveyed households, and discusses the methodology, tools used, and restricted areas within the municipality. The project aims to provide insights into family structures, income, expenses, and other socio-economic variables for informed decision-making.

Download Presentation

Please find below an Image/Link to download the presentation.
The content on the website is provided AS IS for your information and personal use only. It may not be sold, licensed, or shared on other websites without obtaining consent from the author. Download presentation by click this link. If you encounter any issues during the download, it is possible that the publisher has removed the file from their server.
E N D
Presentation Transcript
SPATIAL INTERPRETATION OF SOCIO-ECONOMIC INFORMATION MSDP Project (2011-2031), CDMP-II & UDD Planner Ripan Debnath Decode-Bestway-Geomark JVC
Presentation Outline Basic information Findings of field verification Method & outcome of spatial interpretation Resultant maps/figures Overall scenario Scenario by family types Scenario by structure (settlement) types Remarks Decode-Bestway-Geomark JVC 2
Basic Information Location: Mymensingh Municipality Area type: Urban Total surveyed: 938 households (HH) Sample checked: 208 HH (22%) Spatially linked information: 629 HH (67% of total) Variables considered for spatial interpretation: 21 Nos. Parent classifier: 2 variables Family type (Single & Joint) Settlement type (Pucca & Others) Decode-Bestway-Geomark JVC 3
Findings of Field Verification Variation between the results of total surveyed and checked HHs is ranging within 5% which is generally acceptable and indicates great reliability of the total survey work. Some high deviations have been observed for distance related figures which indicates that most of the field checking were performed within a close proximity to the city center. Coincidently the checked sample HHs belong a rich community since the deviations in income and expenditure proportions have been observed among the upper ranges of the respective classifications. Disaster and other problem related results sustained as were found in previous analysis. Decode-Bestway-Geomark JVC 4
Map of Checked & Spatially Linked Data Decode-Bestway-Geomark JVC 5
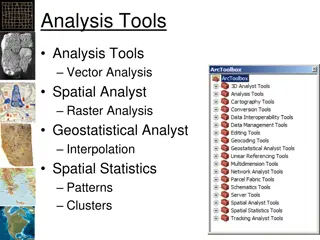
Method & Output Tools used: 3D Analyst Tools Area of exclusion: Restricted & large institutions Output format: Raster Output categories: Overall scenario Parent classifiers oriented Considered Variables Raster Map Decode-Bestway-Geomark JVC 3D Analyst Tools in ArcMap 6
Restricted Areas within Municipality Decode-Bestway-Geomark JVC 7
Summary of Considered Variables Status of Response N 629 619 626 626 218 189 609 522 227 308 81 81 416 570 445 456 582 587 202 629 629 Variable Percent Total family member Type of the Family Monthly Income of the Family Monthly Family Expense of the Family Year of Immigration Reason of Immigration Is the H.H. Owner of the Land/Flat? Type of Structure Land area in katha Value of Land Area of House/Flat (in sq ft) Value of House/Flat Has Land been Filled to Build the House? Which Type of Land Use is Demanded More in this Area? Land value in 2002 Land value in 2007 Land value in 2012 Had anyone been Sick in Last One year? What change has taken place ? Are you interested to change your current LU? Are you interested to leave space for road widening? 100.00% 98.40% 99.50% 99.50% 34.70% 30.00% 96.80% 83.00% 36.10% 49.00% 12.90% 12.90% 66.10% 90.60% 70.70% 72.50% 92.50% 93.30% 32.10% 100.00% 100.00% Decode-Bestway-Geomark JVC 8
Spatial Interpretation OVERALL SCENARIO
Family Type Decode-Bestway-Geomark JVC 10
Family size Decode-Bestway-Geomark JVC 11
Total monthly income Decode-Bestway-Geomark JVC 12
Total monthly expenditure Decode-Bestway-Geomark JVC 13
Land/Flat ownership Decode-Bestway-Geomark JVC 14
Land filling during construction Decode-Bestway-Geomark JVC 15
Current asset (land) value Unexpected scenario at some locations due to less than 50% active responses Decode-Bestway-Geomark JVC 16
Land value in 2002 Decode-Bestway-Geomark JVC 17
Land value in 2007 Decode-Bestway-Geomark JVC 18
Land value in 2012 Decode-Bestway-Geomark JVC 19
Demanding use of land Decode-Bestway-Geomark JVC 20
Land-use change in community Decode-Bestway-Geomark JVC 21
Interest to change current LU Decode-Bestway-Geomark JVC 22
Willingness to offer land for roads Decode-Bestway-Geomark JVC 23
Sickness pattern Decode-Bestway-Geomark JVC 24
Spatial Interpretation SCENARIO BY FAMILY TYPE
Monthly Income: Joint vs. Single family Decode-Bestway-Geomark JVC 26
Expenditure: Joint vs. Single family Decode-Bestway-Geomark JVC 27
Spatial Interpretation SCENARIO BY SETTLEMENT TYPE
Family Income: Pucca vs. Other types Decode-Bestway-Geomark JVC 29
Family expense: Pucca vs. other types Decode-Bestway-Geomark JVC 30
Land value in 2002: Pucca vs. other types Decode-Bestway-Geomark JVC 31
Land value in 2007: Pucca vs. other types Decode-Bestway-Geomark JVC 32
Land value in 2012: Pucca vs. other types Decode-Bestway-Geomark JVC 33
Remarks Contribution of spatial interpretation in MSDP via knowing: Spatial pattern and extent of: Income Expenditure Land value Land-use change, etc. Comparative pattern between: Different family types HH living in Pucca & Other types of houses Decode-Bestway-Geomark JVC 34
THANK YOU ALL FOR YOUR KIND ATTENTION


 value")