Understanding Student Perceptions of Archives Through Survey Data
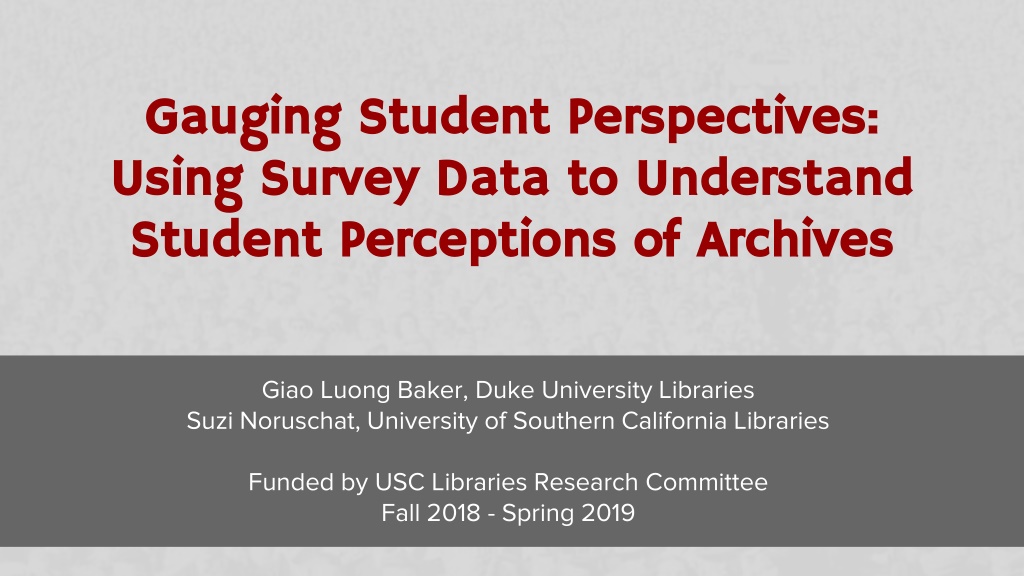
This study conducted by Giao Luong Baker and Suzi Noruschat at Duke University and USC Libraries respectively aimed to gauge student perspectives on archives. They used survey data to analyze how exposure to USC Special Collections and Digital Library resources impacted student perceptions. The methodology involved administering pre and post surveys to students in Fall 2018 classes. Results indicated an increase in confidence among students after instruction, highlighting the importance of educational interventions in improving access to archival materials.

Download Presentation

Please find below an Image/Link to download the presentation.
The content on the website is provided AS IS for your information and personal use only. It may not be sold, licensed, or shared on other websites without obtaining consent from the author. Download presentation by click this link. If you encounter any issues during the download, it is possible that the publisher has removed the file from their server.
E N D
Presentation Transcript
Gauging Student Perspectives: Gauging Student Perspectives: Using Survey Data to Understand Using Survey Data to Understand Student Perceptions of Archives Student Perceptions of Archives Giao Luong Baker, Duke University Libraries Suzi Noruschat, University of Southern California Libraries Funded by USC Libraries Research Committee Fall 2018 - Spring 2019
Question Question Do student perceptions of USC Special Collections and Digital Library resources change after exposure to these resources via instruction or a class assignment? Modern classroom, s.d., USC Digital Library
Methodology Methodology Survey administered to students in Fall 2018 classes Pre and post surveys Pre-survey was taken in person, on paper, before instruction Survey incentive given at time of pre-survey $10 gift cards to Starbucks Post-survey was conducted via Qualtrics
Survey Survey Demographic data Familiarity with resources Confidence level Do they see themselves in these resources?
Sample Questions Sample Questions Multiple Multiple choice with choice with other other Closed Closed question question
Sample Questions Sample Questions Likert Likert Scale Scale
Response Overview Response Overview 56.2% response rate for the post-survey 77% were undergrads 20% Identify as first- generation college student 60% of respondents were white/ 40% non-white Freshman Picnic, May 24, 1889, USC Digital Library
Finding 1 Finding 1 Special Collections Digital Library
Finding 2 Finding 2 Students felt more confident using Special Collections materials after our instruction The pre-survey mean is 2.56 The post-survey mean is 3.73 Return of the Victory Bell, 1952, USC Digital Library
Finding 3 Finding 3 No change in confidence levels for Digital Library resources The pre-survey mean is 3.63 The post-survey mean is 3.93 Coach Boyd with Trojan Basketball team, 1978, USC Digital Library
Finding 4 Finding 4 Students saw themselves and their communities reflected in both Special Collections and Digital Library resources after instruction. Special Collections Data: The pre-survey mean is 3.24 The post-survey mean is 3.74 Digital Library Data: The pre-survey mean is 3.56 The post-survey mean is 3.84 USC Delta Delta Delta Sorority women, s.d., USC Digital Library
Next Steps Next Steps Parse out demographic data further Expand the study to more classes; wider and more representative set of research data Include more institutions?
Thank You! Thank You! Giao Luong Baker giao.baker@duke.edu Presented at 2019 SAA Research Forum August 2, 2019 Suzi Noruschat noruscha@usc.edu