Understanding Growth Companies and Stocks in Stock Valuation
When evaluating stocks for investment, it's essential to consider the difference between a good company and a good investment. While a great company may have strong performance, its stock may be overpriced compared to its intrinsic value, making it a poor investment choice. Growth companies and stocks represent opportunities with potential for higher returns due to undervaluation in the market. Market information is not always perfect, leading to fluctuations in stock pricing. Investors should be cautious of overestimating growth rates, as it can impact their returns negatively.

Download Presentation

Please find below an Image/Link to download the presentation.
The content on the website is provided AS IS for your information and personal use only. It may not be sold, licensed, or shared on other websites without obtaining consent from the author. Download presentation by click this link. If you encounter any issues during the download, it is possible that the publisher has removed the file from their server.
E N D
Presentation Transcript
Company analysis and stock valuation ch14
Company Analysis vs. Stock Valuation Good companies are not necessarily good investments. Why? Compare the intrinsic value of a stock to its market value Stock of a great company may be overpriced (market value is higher than intrinsic value) Which means its not a good stock to invest in although the company s performance is extremely well.
Growth companies and growth stocks Growth company is a: company that has a rate of return that is higher than the required rate of return (WACC). Has the potential for future earning growth. The firm s sales and earnings grow faster than those of a similar risk firms and the overall economy. Younger companies that has above average investment opportunities. These companies retain a large portion of its earning to fund these investment projects. Low dividend payout ratio. Or no dividend sometimes.
Growth companies and growth stocks Growth stock is : Stock with higher expected rate of return than other stocks in the market with similar risk characteristics Achieves this superior risk-adjusted rate of return because the market has undervalued it compared to other stocks.
Growth companies and growth stocks Although stock market adjusts stock prices relatively quickly and accurately to reflect new information, available information are not always perfect or complete. Therefore, incomplete information may cause a stock to be undervalued or overvalued at a point in time. If the stock is undervalued, its price should eventually reflect the true fundamental value when the correct information becomes available. During this period of price adjustment, it will be a growth stock.
Growth companies and growth stocks Growth stock are not necessarily limited to growth companies. It can be the stock of any type of company as long as this stock is undervalued by the market.
Growth companies and growth stocks Example, if an overeager investor tend to overestimate the expected growth rate of earnings and cash flows for a growth company and inflate the price of a growth company stock. Then investors who paid the inflated stock price will earn a rate of return below the risk adjusted required rate of return.
Defensive companies vs defensive stock Defensive Company: Whose future earnings are likely to resist an economic downturn Normally have low business risk and not excessive financial risk Supply basic consumer necessities such as Public utilities or grocery stores.
Defensive companies vs defensive stock Defensive stock: Rate of return is not expected to decline during an overall market decline or decline less than the overall market. Stock with low or negative systematic risk Or in other words, a stock that has a low positive or negative beta (the expected return of an asset based on its expected market returns is low)
Cyclical companies and cyclical stocks Cyclical companies: Sales and earnings will be heavily influenced by aggregate business activity Outperform other firms during economic expansion Underperform during economic contractions High volatility in sales (high business risk and financial risk) Example steel, auto or heavy machinery industries
Cyclical companies and cyclical stocks Cyclical stock: Experiences changes in rates of return greater than changes in overall market rates of return Stocks with high betas
Speculative companies vs speculative stocks Speculative companies Whose assets involve greater risk but that also has a possibility of greater gain Speculative stock Possesses a high probability of low or negative rates of return
Speculative stocks One that is overpriced, leading to a high probability that during the future period when the market adjusts the stock price to its true value, Will experience either low or possibly negative rates of return Might be the case for an excellent growth stock that is substantially overvalued
Firms Overall Strategic Approach Porter suggests two major strategies: Low-Cost Strategy The firm seeks to be the low-cost producer, and hence the cost leader in its industry Cost advantages vary by industry and might include economies of scale, proprietary technology, Differentiation Strategy Firm positions itself as unique in the industry in an area that is important to buyers A company can attempt to differentiate itself based on its distribution system or some unique marketing approach
Company Analysis SWOT analysis Strengths Weaknesses Opportunities Threats
SWOT Analysis Internal Analysis Strengths Give the firm a comparative advantage in the marketplace Perceived strengths can include good customer service, high-quality products, strong brand image, customer loyalty, innovative R&D, market leadership, or strong financial resources Weaknesses Weaknesses result when competitors have potentially advantages over the firm
SWOT Analysis External Analysis Opportunities These are environmental factors that favor the firm They may include a growing market for the firm s products (domestic and international), shrinking competition, favorable exchange rate shifts Threats They are environmental factors that can hinder the firm in achieving its goals Examples would include a slowing domestic economy, additional government regulation, an increase in industry competition, threats of entry,
Some Lessons from Peter Lynch Favorable Attributes of Firms may result in favorable stock market performance Firm s product should not be faddish Firm should have some long-run comparative advantage over its rivals Firm s industry or product has market stability Firm can benefit from cost reductions
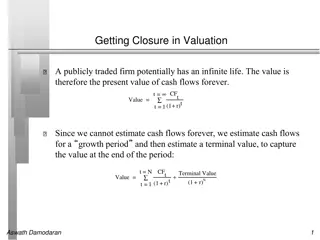
Estimating Intrinsic value Present value of cash flows (PVCF) Present value of dividends (DDM) Present value of free cash flow to equity (FCFE) Present value of free cash flow (FCFF) Relative valuation techniques Price earnings ratio (P/E) Price cash flow ratios (P/CF) Price book value ratios (P/BV) Price sales ratio (P/S)
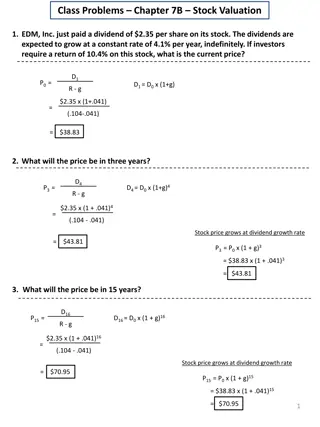
Present Value of Dividends Dividend discount model (DDM). This model has a typical assumption that the dividend will grow at a constant rate over time. Although this assumption is not realistic for fast growing or cyclical firms, this assumption may be appropriate for many mature firms
DDM More complex DDM exist for more complicated growth forecast including two stage growth models (a period of fast growth followed by a period of a constant growth) Or three stage growth model ( a period of a fast growth followed by a period of diminishing growth followed by period of constant growth)
DDM Constant Growth DDM Intrinsic Value = D1/(k-g) and D1= D0(1+g) Growth Rate Estimates Average Dividend Growth Rate Dn D0 n g = -1 Sustainable Growth Rate g = RR X ROE
DDM Required Rate of Return Estimate Nominal risk-free interest rate Risk premium (expected return on the market risk free rate) Beta is estimated by regressing market return on the stock return. And the slope of this regression line is the stock measure of systematic risk. E(Rstock) = RFR+ stock[E(Rmarket) RFR]
DDM The Present Value of Dividends Model (DDM) Model requires k>g With g>k, analyst must use multi-stage model
Present Value of Operating Free Cash Flow Discount the firm s operating free cash flow to the firm (FCFF) at the firm s weighted average cost of capital (WACC) Computing FCFF FCFF =EBIT (1-Tax Rate) + Depreciation Expense - Capital Spending - in Working Capital
Present Value of Operating Free Cash Flow An alternative measure of long-run growth g = (RR)(ROIC) where: RR = the average retention rate ROIC = EBIT (1-Tax Rate)/Total Capital (return on invested capital) Computation of WACC WACC=WEk+ WDi where: WE= the proportion of equity in total capital k = the after-tax cost of equity (from the SML) WD= the proportion of debt in total capital i = the after-tax cost of debt
Analysis of Growth Companies Generating rates of return greater than the firm s cost of capital is considered to be temporary why? because in a competitive economy, if the rate of return for a given company exceed the rate of return expected based on the risk involved, then other companies will inter the industry, increase the supply , and eventually drive prices down until the rate of return earned on a capital invested are consistent with the risk involved.
Analysis of Growth Companies Earnings higher the required rate of return are pure profits How long can they earn these excess profits? Is the stock properly valued? Type of firms in term of growth( we assumed in the following slides that the company is all equity firm) No growth firms Long-run growth models
No-Growth Firm Generate a constant stream of cash flows, E r = rate of return on assets E = r Assets Since b, the rate of retention is 0 E = r Assets = Dividends V = Required Rate of Return
Long-Run Growth Models Assume some of the earnings are reinvested then the value of an all equity firm is the value of the following components: 1. E = the level of constant net earnings expected from existing assets, without further net investments 2. G = the growth component that equals to the present value of capital gains expected from reinvested funds The return on invested fund = r = mk m = rate of return on funds retained (r/k) If m=1, then r =k If m>1, then r > k If m<1, then r<k 3.bE = the proportion of earning that is reinvested, where b is the percent of retention.
Long Run Growth Simple growth model: This model assumes the firm has growth opportunities that provides rates of return equal to r (where r is greater than k or m>1) Also, it assumes that the firm can invest $R at that rate of return where R =bE, R is constant dollar amount because E is constant. The value of this firm: V= E/k + bE (m-1)/k The first part of the equation is the present value of a constant earning and the second part of the equation is the present value of excess earning from growth investment
Long Run Growth Negative Growth Model Firm retains earnings, but reinvestment returns rate are below the firm s cost of capital. That is, r<k or m<1 Since growth will be positive (r>0) but slower than it should be (r<k), the value will decline when the investors discount the reinvestment stream at the cost of capital
Capital Gain components The three factors that influence the capital gain component: The amount of capital invested in growth investments (b) The relative rate of return earned on the funds retained (m) The time period for these growth investments
Long Run Growth Dynamic True Growth Model Firm invests a constant percentage of current earnings in projects that generate rates of return above the firm s required rate of return In this case, r>k and m>1 In this model the amount invested is growing each ear as earning increase. Firm value for the dynamic growth model for an infinite time period D = 1 V k g
Growth Duration Model No company can grow indefinitely at a rate substantially above normal. The purpose is to evaluate the high P/E ratio for the stock of a growth company by relating its P/E ratio to the firm s rate of growth and duration of growth A stock s P/E is function of expected rate of growth of earnings per share stock s required rate of return firm s dividend-payout ratio
Growth Duration Model The growth estimate must consider both the rate of growth and how long this growth rate can be sustained that is, the duration of the expected growth rate In order to apply the growth duration model we have to assume: 1. Equal risk in both firms we are comparing. (beta close to 1) 2. No significant difference in the payout ratio for these firms
Factors to consider Inconsistency between the expected growth and the P/E ratio could be attributed to one of the four reasons: A major difference in the risk involved Inaccurate growth estimates Stock with a low P/E relative to its growth rate is undervalued Stock with high P/E and a low growth rate is overvalued
Computation of Growth Duration Example on board in class
When to sell? Many times holding the stock for too long leads to a return below expectations or less than what was available earlier. Analysis of the stock doesn t end when intrinsic value is computed. If the key value drivers of the stock weakened or if there's a huge change in the management, it is time to revaluate and possibly sell the stock. The stock should also be closely evaluated when the current value approaches its intrinsic value estimate. When the stock becomes fairly prices then it may be time to sell the stock.