Understanding Stocks and Stock Changes in Food Balance Sheets
Delve into the world of Food Balance Sheets (FBS) to comprehend the significance of stocks and stock changes. Learn about different data sources, estimation approaches, definitions of stocks in FBS, reasons for maintaining stocks, accounting methods, and more. Explore the complexities and importance of tracking stocks in the food supply chain.
Download Presentation

Please find below an Image/Link to download the presentation.
The content on the website is provided AS IS for your information and personal use only. It may not be sold, licensed, or shared on other websites without obtaining consent from the author. Download presentation by click this link. If you encounter any issues during the download, it is possible that the publisher has removed the file from their server.
E N D
Presentation Transcript
Food Balance Sheets FBS component: Stocks and stock changes
Learning Objectives At the end of this presentation, the audience will know: a) Different data sources for stocks and stocks changes b) Recommended approach for estimating stocks changes 2
Outline 1. Definitions 2. Data sources 3. Imputation and Estimation 3 3
Definitions 4 4
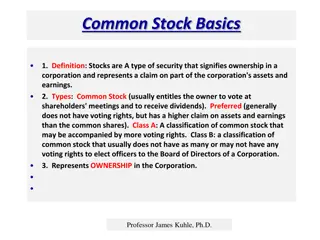
Definition of Stock in FBS Stocks Stocks are defined as the aggregate total of product allocated to storage for use at some future point in time Stocks can be held by a variety of actors at any level of the supply chain from production to retail. Who holds commodity Stocks? governments, manufacturers, importers, exporters, resale or wholesale merchants, farmers 5 5
Definition of Stock in FBS Change in stocks In principal, changes in stocks comprises changes in stocks occurring during the reference period at all levels from production to retail level, i.e. it comprises changes in: Government stocks, Stocks with manufactures, Importers, Exporters Other whole sale and retail merchants Transport and storages enterprises Stocks in farms 6 6
Definition of Stock in FBS Why are stocks kept? Stocks are kept: to smooth consumption levels between harvests To Insure against food shortages To Increase market power 7 7
How to account in for stocks? Stocks can be account in for in two ways 1. First way First of all, stock levels at both the beginning and end of the period can be noted Domestic supply = domestic utilization: ??????? ?????? + ?????????? + ??????? ??????? = ???? + ???? + ???? + ??????? ???? + ?????????? ??? + ???? + ???????? ??? + ??????? ?????? Total supply = total utilization: ??????? ?????? + ?????????? + ??????? = ??????? + ???? + ???? + ???? + ??????? ???? + ?????????? ??? + ???? + ???????? ??? + ??????? ?????? 8 8
How to account in for stocks? 2. Second way Alternatively, the FBS framework can be elaborated by estimating the change in stocks from one time period to the next as a component of supply Domestic supply = domestic utilization: ?????????? + ??????? ??????? ??????? = ???? + ???? + ???? + ??????? ???? + ?????????? ??? + ???? + ???????? ??? Total supply = total utilization: ?????????? + ??????? ??????? = ??????? + ???? + ???? + ???? + ??????? ???? + ?????????? ??? + ???? + ???????? ??? where ??????? = ??????? ?????? ??????? ??????. 9 9
Data sources 10 10
Data sources Official data sources Official government agricultural surveys are the preferred mechanism through which to collect data on stock levels. Farm surveys can produce estimates of on-farm stocks, Surveys of processors, manufacturers, exporters, or distributors can target stockholding elsewhere in the supply chain. Governments themselves may also be large stockholders of certain food commodities 11 11
Data sources Official data sources AMIS recommandation: Public sector stocks data Make explicit efforts to measure stock levels of major commodities rather than rely on an imputation or estimation approach Farm level stocks data Private sector stocks data The first of these recommendations is the adding of a stocks module to periodic agricultural production surveys The second action is the reporting of government-held stock levels Overall picture of the country s stocks situation should be mostly complete 12 12
Data sources Official data sources Additionally, the Global Strategy has included this variable in the minimum set of core data that should be measured and disseminated annually (FAO et al., 2012). 13 13
Data sources Alternative data sources Outside of official sources, data on stocks are often limited to only one aspect of the marketing chain (processors, for example) For this reason, countries are encouraged to develop strategies to survey overall stock levels in an official capacity rather than rely on incomplete estimations from one segment of the supply chain However, for some supply chains reports of stock levels from processors or industry could account for the majority of stockholdings, and thus be invaluable to estimating total stock levels. 14 14
Data sources Alternative data sources Consult the AMIS database, which estimates closing stock levels for maize, wheat, rice, and soybeans for more than 20 of the world s largest producers and consumers of those commodities http://statistics.amis-outlook.org/data/index.html#HOME. Similarly, estimates on global sugar stocks can be accessed from F.O. Licht https://www.agra-net.com/agra/international-sugar-and-sweetener-report/. 15 15
Imputation and estimation 16 16
Imputation and estimation A few different approaches can be used to impute or estimate stock changes, subject to some cumulative constraint on stock levels. The approaches may vary depending upon the commodity in question. 17 17
Imputation and estimation Recommended approaches The recommended approach is a purely mathematical point of view based on the supply=utilization identity. What motivates the choice of this approach? stocks represent the mismatch between supply and utilization in a given year. most domestic utilizations tend to change little from year to year, Therefore, changes in stock positions tend to be correlated with changes in domestic supply (that is, production plus imports, minus exports). As such, changes in stocks can be modeled as a function of changes in internal supply. 18 18
Imputation and estimation Recommended approaches The function is written as follow: ???????= ? ??????? + ?? Where: ????????is equivalent to ??????? ??????? 1, ???????is equivalent to [?????????? + ??????? ???????]? [?????????? + ??????? ???????]? 1, and tis an error term. 19 19
FBS component: Stocks and stock changes Imputation and estimation Recommended approaches FBS compilers can estimate this relationship using regression analysis and choose the functional form most appropriate for their situations. Compilers may wish to add additional variables in their regressions, but the basic approach should remain the same 20 20
Imputation and estimation Recommended approaches The imputation of stock changes through this recommended approach relies on countries having historically measured stock levels for the commodity in question Estimates of stock changes derived from regressions must be checked against a constraint for cumulative stock levels. That is, a negative stock change in any given year may not exceed the previous level of stocks The last concept to keep in mind when modelling stock changes is that over several successive years, cumulative stock changes should sum to approximately zero 21 21
Imputation and estimation Alternative approach If historical data on stock levels for grains, pulses, sugar, and oilseeds, are not available, compilers can preliminarily use stocks to balance the supply and demand equation, But this approach should only be utilized in instances where there is some measured data used to derive the food estimate. Otherwise, compilers are dealing with an equation with two unknowns, and error cannot properly be accounted for. Even in this case, compilers must check cumulative changes against a running estimate of stock levels to ensure that estimated changes are feasible. 22 22
Imputation and estimation Alternative approach For some perishable products, stock changes can be used to smooth supply fluctuations from year-to-year. In these cases, compilers should be aware that stocks accumulated in one year should in most cases be entirely or nearly entirely used in the following year. Compilers should also consider adjusting losses to account for any stocks not allocated to consumption in the following year. However, before this approach is followed, compilers should have a solid understanding of the supply chain for the respective product. 23 23
References 3rdChapter of the guideline: Data for FBS compilation: considerations, sources and imputation , 3.5.3 Stocks/stock changes Agricultural Market Information System, Expert Meeting on Stocks Measurement, 21 November 2014, International Grains Council, London 24 24


