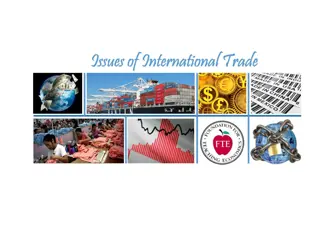
Insights into U.S. Port Performance and Trade Trends
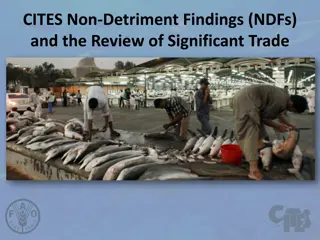
This compilation presents a snapshot of the Port of Virginia's response to the Panama Canal and explores forecasted global demand for containerized trade. The data further delves into historic port performance, U.S. port rankings, top customers, and trading partners in 2010, shedding light on the East Coast ports' market share and top trading partners.

Download Presentation

Please find below an Image/Link to download the presentation.
The content on the website is provided AS IS for your information and personal use only. It may not be sold, licensed, or shared on other websites without obtaining consent from the author. Download presentation by click this link. If you encounter any issues during the download, it is possible that the publisher has removed the file from their server.
E N D
Presentation Transcript
The Port of Virginia Response to the Panama Canal NOAA Hydrographic Services Review Panel Ms. Heather Wood Director, Environmental Affairs Virginia Port Authority October 26, 2011
Forecasted Global Demand Containerized Trade Grows 2X Faster Than GDP U.S. GDP and TEU Trade: 1980 - 2010 600 - 40 500 U.S TEUs TEU Index (Millions) 400 - 30 GDP Index U.S GDP 300 - 20 200 - 10 100 - 0 0
Historic Port Performance 1.4 1.2 1.0 CONTAINERS (MILLIONS) 0.8 0.6 0.4 0.2 0.0 1978 1979 1980 1981 1982 1983 1984 1985 1986 1987 1988 1989 1990 1991 1992 1993 1994 1995 1996 1997 1998 1999 2000 2001 2002 2003 2004 2005 2006 2007 2008 2009 2010
2010 Top 10 U.S. Ports Rank Port TEUs U.S. Market Share 20% 16% 14% 7% 6% 6% 5% 5% 4% 4% 1 2 3 4 5 6 7 8 9 10 Los Angeles Long Beach New York/New Jersey Savannah Oakland Seattle The Port of Virginia Houston Tacoma Charleston 7,831,902 6,263,499 5,292,025 2,825,179 2,330,214 2,139,577 1,895,018 1,812,268 1,455,466 1,364,504
2010 Top 10 U.S. East Coast Ports U.S. East Coast Market Share 35% 19% 13% 9% 6% 6% 5% 4% 2% 1% RankPort TEUs 1 2 3 4 5 6 7 8 9 10 New York/New Jersey Savannah The Port of Virginia Charleston Jacksonville Miami Port Everglades Baltimore Wilmington (NC) Palm Beach 5,292,025 2,825,179 1,895,018 1,364,504 856,636 844,996 798,150 610,918 265,074 216,967
2010 Top Customers Export Meadwestvaco Archer Daniels Midland Weyerhaeuser Domtar Paper E I DuPont De Nemours Surface Deployment & Distribution Honeywell America Chung Nam Army & Air Force Exchange Fornazor International Import Target Wal-Mart Home Depot Red Bull Lumber Liquidators QVC Cost Plus Lowe s Hooker Furniture Family Dollar Stores
2010 Top Trading Partners EXPORT China Germany Belgium Netherlands Indonesia India Brazil Japan United Kingdom Saudi Arabia IMPORT China Germany India Brazil Italy Indonesia Netherlands Belgium France Vietnam
2011 Complete Fiscal Year, July-June FY 2011 FY 2010 Change 1,903,162 1,848,940 +2.9 Total TEUs 1,015,970 979,808 +3.7 Export TEUs 887,192 869,132 +2.1 Import TEUs Total Rail Containers VIP Containers 304,731 236,597 +28.8 32,958 28,208 +16.8 Source: Terminal Statistics 1,798 1,844 -2.5 Ship Calls Breakbulk Tonnage 304,626 222,337 +37.0
World Trade Lanes Lead to The Port of Virginia 1 1 1 3 1 2 2 2 China to West Coast India/Southeast Asia to East Coast Through Suez Canal China to East Coast Through Panama Canal
Ideally Located Central location along the Atlantic Coast Nearly 50 percent of the nation s population and 50 percent of the manufacturing activity are within a day s drive of the Port of Virginia Well-developed transportation system provides access to major markets: The 3rd largest state maintained transportation network The 3rd largest container port on the U.S. East Coast and the Virginia Inland Port provides an interface between truck and rail services for transfer of ocean-going containers
Rail Gateway to the Midwest Serviced by Two Class 1 Railroads Expanded On Dock Rail Yard at NIT Dual Access at APMT Dual Access at PMT for Breakbulk and/or RoRo CSX Breakbulk rail service at NNMT Higher Percentage of Railed Cargo Than Other U.S. East Coast Ports
Selected Distribution Facilities Using The Port of Virginia
Panama Canal vs. Suez Canal Port of Virginia Hong Kong, China Suez Canal Suez Canal Panama Canal Via Panama Canal Via Suez Canal Distance: 11,021 nautical miles Distance: 11,705 nautical miles
Suez Canal Mediterranean Sea Port Said Lake Timsah Bitter Lakes Sinai Peninsula Suez Overall length: 120 miles Width: 590ft / 622ft Max. permissible draft: 62ft The canal is sea level, no locks.
Expansion of the Panama Canal $5.25 billion capital investment program to modernize and improve the Panama Canal $190 million channel deepening project began in 2002 $1.6 million project to redesign a third set of locks
Panama Canal Expansion - New Locks Will Accommodate Post-Panamax Vessels Existing Locks Max Vessel size: 4,400 TEU s 32.3 m (106 ) 12.4 m (39.5 ) 12.8 m (42 ) 49 m (160 ) New Locks Will Accommodate Post-Panamax Vessels 18.3 m (60 ) 15.2 m (50 ) New Locks Max Vessel size: 12,600 TEU s
Panama Canal Expansion Will Increase Business at Port of Virginia Route for Asia to Atlantic Ports Completion by 2015 Virginia is the only east coast port with deep enough channels for biggest ships
50 Foot Channel Depth 55 ft. channel authorized (includes 60 ft. Atlantic Ocean channel)
U.S. East Coast Competitive Ports Water Depth Jacksonville 4,500 TEU 38 ft Wilmington, NC 42 ft Savannah 8,500 TEU 45 ft Charleston NY/NJ (2012) Baltimore 12,500+ TEU 50 ft Norfolk Norfolk 55 ft (authorized) Based on fully loaded vessel
Unobstructed Access Current minimum required clearance 190 feet Bayonne Bridge (entrance to Port of NY/NJ) air draft 151 feet Emma Maersk carries 11,000-13,500 TEUS, and requires 185-195 feet of air draft
VA OS Wind Lease Blocks
MSC Bruxelles At 1,105 feet long, and 9,200 TEUs, the MSC Bruxelles holds the record for the biggest containership ever to enter the Hampton Roads Harbor. Vessels of this size regularly call on The Port of Virginia Our channels and terminals can handle these vessels fully loaded unlike any other port on the East Coast
Regional Transportation Projects Chesapeake Bay NNMT Patriot s Crossing Port Briefing Access, Unrestricted Air Draft I-564 Connector 50 ft. Deep Water Craney Island Marine Terminal NIT CIDMMA Craney Island Road & Rail Connector APM Commonwealth Railway Safety Mainline Relocation PMT
APM Terminals Virginia Leased to the VPA, Operated by VIT, Inc. Phase 1 Sept. 2007 Total Acreage: 230 Pier Length: 3,200 ft Depth: 55 ft Cranes: 6 Capacity: 1 Million TEUs Cost: $500 Million CSX and NS Served
APMT Phase 2 Most Technologically-Advanced Marine Terminal in North America Room for Expansion APMT II APMT I
Future Craney Island Marine Terminal Phase 1 June 2025 Total Acreage: 220 Pier Length: 3000 ft. Depth: 52 ft. Cranes: 6 Capacity: 1.5M TEUs Cost: $1.2B
Portsmouth Marine Terminal Land Area: 285 acres (land and pier only) Direct rail service with CSX; also Norfolk Southern via Norfolk and Portsmouth Belt Line. Shipside rail service is available
Newport News Marine Terminal WWL Auto Processing
The Heartland Corridor New route is double-stack eliminates more than 230 miles. Opened Sept. 2010.
The National Gateway Connects Norfolk to the Midwest and beyond Chicago Pittsburgh NY/NJ/PA NW Ohio Transfer Yard enables CSX service to new major markets Columbus St Louis Norfolk Expedites traffic through Chicago and St. Louis gateways Memphis Birmingham Atlanta Jacksonville CSX National Gateway CSXT double stack routes Other CSXT routes New Orleans Tampa Miami
Virginia Inland Port Five-day-a-week rail service between the VIP and the Hampton Roads marine terminals Within 1 mile of Interstate 66 and within 5 miles of Interstate 81
James River Barge Line 64 Express Weekly calls between the Port of Virginia and the Port of Richmond Calls at NIT and PMT Door service availability Green transportation alternative
The Port of Virginia's Response OPEN FOR BUSINESS NOW! 22 Suez/Post-Panamax Cranes 50 - 55 Channel No Air Restrictions 2 World Class Rail Roads $2B+ Infrastructure Investment
How You Can Help? Maintain unobstructed deep water channels & approaches Safe efficient passage on approaches in all but extreme weather conditions Continued Data Collection & Dissemination Recognize the future of the Port and the Opportunities for Virginia & the East Coast Communication & Education
Hydrographic Services Review Panel Norfolk Ms. Heather Wood Director, Environmental Affairs Virginia Port Authority October 26, 2011