Mathematics Revision: Percentages, Investments, and Geometry

Practice solving percentage problems involving salary increases, depreciation, compound interest, and discounts. Explore concepts of congruence and similarity in triangles, as well as work with surface areas and volumes of cones.

Download Presentation

Please find below an Image/Link to download the presentation.
The content on the website is provided AS IS for your information and personal use only. It may not be sold, licensed, or shared on other websites without obtaining consent from the author. Download presentation by click this link. If you encounter any issues during the download, it is possible that the publisher has removed the file from their server.
E N D
Presentation Transcript
Test 3 Revision YEAR 10 ENHANCED
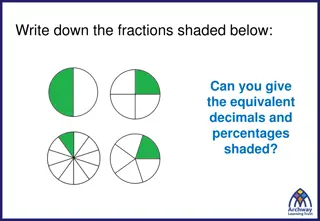
Topic 9Write down the decimal amount by: William s salary is 24 000. His salary increases by 4%. Ann buys a dress in a sale. The normal price of the dress is reduced by 20%. The normal price is 36.80 Work out the sale price of the dress. A company bought a van that had a value of 12 000 The value of the van depreciates by 25% per annum. Work out the value at the end of three years. Sally invested some money. The interest for the 1styear was 3%. For the next two years she was paid interest at 2%. At the end of the third year she had 3750.64. What did she originally invest? multiplier to (a) increase and (b) decrease an 15% 7% 4.8% Work out William s new salary. A person's weekly wage was 336, but now he earns 420. What is the percentage increase in their wage? Jack invests 3000 for 2 years at 4% per annum compound interest. Work out the value of the investment at the end of 2 years. Mrs Pitt sold their house for 168 000. They made a profit of 12% on the price they paid for the house. Calculate how much they paid for the house. In a sale, normal prices are reduced by 12%. The sale price of a laptop is 242. Work out the normal price of the lap top. Percentages
Topic 9Write down the decimal amount by: William s salary is 24 000. His salary increases by 4%. Work out William s new salary. 24000 x 1.04 = 24 960 Ann buys a dress in a sale. The normal price of the dress is reduced by 20%. The normal price is 36.80 36.80 x 0.80 Work out the sale price of the dress. 29.44 multiplier to (a) increase and (b) decrease an 15% (a) 1.15 (b) 0.85 7% (a) 1.07 (b) 0.93 4.8% (a) 1.048 (b) 0.952 A man's weekly wage was 336, but now he earns 420. What is the percentage increase in his wage? 84 336 Jack invests 3000 for 2 years at 4% per annum compound interest. A company bought a van that had a value of 12 000 The value of the van depreciates by 25% per annum. Work out the value at the end of three years. 12000 x 0.753 = 5062.50 Work out the value of the investment at the end of 2 years. 3000 x 1.042= 3244.80 In a sale, normal prices are reduced by 12%. The sale price of a laptop is 242. Work out the normal price of the lap top. 242 0.88 = 275 x 100 = 25% Mrs Pitt sold their house for 168 000. They made a profit of 12% on the price they paid for the house. Calculate how much they paid for the house. 168000 1.12 = 150 000 The interest for the 1styear was 3%. For the next two years she was paid interest at 2%. At the end of the third year she had 3750.64. What did she originally invest? 3750.64 1.02 1.03 = 3500 Percentages
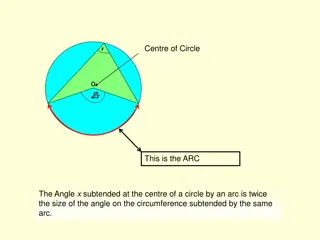
Decide if these triangles are congruent. State the congruency rule used. AB is parallel to DC. The lines AC and BD intersect at E. a) Explain why triangle ABE and triangle CDE are similar. b) Calculate the length of AC. A Topic 10 8 cm NOT Diagram accurately drawn B E 5 cm D C 6 cm Calculate the length of BE. Calculate the length of ED Two cones, P and Q, are similar. The total surface area of cone P is 24 cm . The total surface area of cone Q is 96 cm The height of cone P is 4 cm. (a) Work out the height of cone Q. Congruence and Similarity The volume of cone P is 12 cm . (b) Work out the volume of cone Q.
Decide if these triangles are congruent. State the congruency rule used. AB is parallel to DC. The lines AC and BD intersect at E. a) Explain why triangle ABE and triangle CDE are similar. Angles are all equal b) 8 cm Topic 10 Length of AC = 62 3+ 5 =112 3 NOT Diagram accurately drawn B A YES SSS YES SAS AE =5 x 8 6 = 62 3 E 5 cm NO D C 6 cm Two cones, P and Q, are similar. The total surface area of cone P is 24 cm . The total surface area of cone Q is 96 cm The height of cone P is 4 cm. (a) Work out the height of cone Q. Area SF = 96 24 = 4 Linear SF = 4= 2 4cm x 2 = 8 cm BE = 7 x 9 12= 5.25 Congruence and Similarity AD = 6 x 12 ED = 8 6 = 2 9= 8 The volume of cone P is 12 cm . (b) Work out the volume of cone Q. Linear SF 2 Volume SF = 2 = 8 12cm x 8 = 96 cm
What is the equation of the line? y 4y 5x = 2 2y - 6x 5 = 0 3 The line L is shown on the grid. Topic 11 DO NOT WRITE IN THIS AREA Write down the: a) y intercept b) gradient c) perpendicular gradient Write down the: a) y intercept b) gradient c) perpendicular gradient 2 1 L O x 1 1 3 5 2 4 1 Find the gradient of the line joining (-2, 4) and (7, 9) Find the equation of the line which passes through the point (3, 2) and is parallel to y = 2x + 3 2 3 4 5 6 DO NOT WRITE IN THIS AREA 7 Find the equation of the line which passes through the point (8, 3) and is perpendicular to y = 4x - 1 A triangle has vertices P, Q and R. The coordinates of P are ( 3, 6) The coordinates of Q are (1, 4) The coordinates of R are (5, 2) M is the midpoint of PQ. N is the midpoint of QR. Find an equation for L. y = mx + c Prove that MN is parallel to PR. You must show each stage of your working. DO NOT WRITE IN THIS AREA ...................................................... (Total for Question 3 is 3 marks) 4 *P48528A0424*
Equation of the line y = 3x - 6 y 2 2y - 6x 5 = 0 y = 3x + 2.5 a) y intercept 2.5 b) Gradient 3 c) perpendicular gradient 1 4y 5x = 2 y = 5 a) y intercept 1 b) Gradient 5 c) perpendicular gradient 4 4 x + 1 2 3 The line L is shown on the grid. Topic 11 2 DO NOT WRITE IN THIS AREA 1 L 4 O x 1 1 3 5 2 4 1 3 5 2 Find the gradient of the line joining (-2, 4) and (7, 9) Find the equation of the line which passes through the point (3, 2) and is parallel to y = 2x + 3 y = 2x + c 2 = 2(3) + c c = - 4 y = 2x - 4 3 4 5 6 9 4 7 2= 5 DO NOT WRITE IN THIS AREA 7 9 Find an equation for L. Find the equation of the line which passes through the point (8, 3) and is perpendicular to y = 4x - 1 y = 1 3 = 1 Y = 1 A triangle has vertices P, Q and R. Draw a diagram. P ( 3, 6) Q (1, 4) R (5, 2) M is the midpoint of PQ. N is the midpoint of QR. Prove that MN is parallel to PR. M = 2 , 2 M = (-1 , -1 ) N = ( 3 , 1 ) Gradient MN = 1 1 Same gradient Gradient PR = 2 6 ...................................................... 1 + 3 4 + 6 1 + 5 2 4 + 2 N = , 2 4 x + c 4 (8) + c c = 5 4 x + 5 y = mx + c 3 1 = 2 4 = 1 DO NOT WRITE IN THIS AREA 2 5 3 = 4 8 = 1 2 must be parallel (Total for Question 3 is 3 marks) 4 *P48528A0424*
The scatter graph shows information about the height and weight of ten students. a) What type of correlation does this scatter graph show? b) One pupil had their height incorrectly measured. Write down the co-ordinate of this pupil. c) Another student is 110 cm tall. Would it be sensible to estimate their weight? Explain. Topic 12 100 90 80 70 Scatter Graphs and Time Series 60 Weight in kg 50 40 30 20 10 0110 170 120 130 140 Height in cm 150 160
The scatter graph shows information about the height and weight of ten students. a) What type of correlation does this scatter graph show? b) One pupil had their height incorrectly measured. Write down the co-ordinate of this pupil. c) Another student is 110 cm tall. Would it be sensible to estimate their weight? Explain. 110cm is outside the range of data collected so it would not be an accurate prediction as it would be extrapolated. Topic 12 positive (140, 40) 100 90 80 Scatter Graphs and Time Series 70 60 Weight in kg 50 40 30 20 10 0110 170 120 130 140 Height in cm 150 160
Answer ALL questions. Write your answers in the spaces provided. DO NOT WRITE IN THIS AREA You must write down all the stages in your working. 1 The scatter diagram shows information about 12 girls. It shows the age of each girl and the best time she takes to run 100 metres. The scatter diagram shows information about 12 girls. It shows the age of each girl and the best time she takes to run 100 metres. Topic 12 17 16 a) Write down the type of correlation. DO NOT WRITE IN THIS AREA 15 Time in seconds Kristina is 11 years old. Her best time to run 100 metres is 12 seconds. Time in seconds 14 Scatter Graphs and Time Series b) The point representing this information would be an outlier on the scatter diagram. Explain why. 13 12 c) Debbie is 15 years old. Debbie says, The scatter diagram shows I should take less than 12 seconds to run 100 metres. Comment on what Debbie says. 11 DO NOT WRITE IN THIS AREA 10 9 10 11 12 13 14 15 Age in years (a) Write down the type of correlation. .............................................................................................................. (1) 2 *P48864A0224*
Answer ALL questions. Write your answers in the spaces provided. DO NOT WRITE IN THIS AREA You must write down all the stages in your working. 1 The scatter diagram shows information about 12 girls. It shows the age of each girl and the best time she takes to run 100 metres. The scatter diagram shows information about 12 girls. It shows the age of each girl and the best time she takes to run 100 metres. Topic 12 17 16 a) Write down the type of correlation. DO NOT WRITE IN THIS AREA negative 15 Time in seconds Time in seconds Kristina is 11 years old. Her best time to run 100 metres is 12 seconds. b) The point representing this information would be an outlier on the scatter diagram. Explain why. It would not follow the general pattern of the rest of the data 14 Scatter Graphs and Time Series 13 12 c) Debbie is 15 years old. Debbie says, The scatter diagram shows I should take less than 12 seconds to run 100 metres. Comment on what Debbie says. 15 years is outside the range of data collected, so this value has been extrapolated and is therefore not accurate. 11 DO NOT WRITE IN THIS AREA 10 9 10 11 12 13 14 15 Age in years (a) Write down the type of correlation. .............................................................................................................. (1) 2 *P48864A0224*
The table shows the number of students in each year group at a school. Mary wants to estimate the number of fish in a lake. She catches 40 fish, marks them and puts them back in the lake. Later she catches another 40 fish and finds that 5 of them are marked. Work out an estimate for the number of fish in the lake. Topic 12 Jenny is carrying out a survey for her GCSE Mathematics project. She uses a stratified sample of 60 students according to year group. Calculate the number of Year 11 students that should be in her sample. Scatter Graphs and Time Series A gift shop sells wrapping paper. The table gives information about the sales of wrapping paper for successive four- month periods from the start of 2017 to the end of 2018. Complete the table to show the last two 3 three-point moving averages. Sales Three point moving average Year ( hundreds) 20 2017 Jan Apr May Aug 22 25 Sept - Dec 33 27 2018 Jan Apr 26 May Aug 25 Sept - Dec 36
The table shows the number of students in each year group at a school. Mary wants to estimate the number of fish in a lake. She catches 40 fish, marks them and puts them back in the lake. Later she catches another 40 fish and finds that 5 of them are marked. Work out an estimate for the number of fish in the lake. 40 ?= 40 Topic 12 Jenny is carrying out a survey for her GCSE Mathematics project. She uses a stratified sample of 60 students according to year group. Calculate the number of Year 11 students that should be in her sample. 5 Scatter Graphs and Time Series 130 750 60 = 10 N = 320 A gift shop sells wrapping paper. The table gives information about the sales of wrapping paper for successive four- month periods from the start of 2002 to the end of 2004. Complete the table to show the last two 3 three-point moving averages. Sales Three point moving average Year ( hundreds) 20 2017 Jan Apr May Aug 22 25 Sept - Dec 33 27 2018 Jan Apr 26 (33 + 26 + 25) 3 = 28 May Aug 25 (26 + 25 + 36) 3 = 29 Sept - Dec 36