Understanding Resolution in Crystallography
Explore the intricacies of crystallography resolution, data cutting strategies, and publication criteria in chemical crystallography. Learn about R factors, Gaussian error averaging, and the importance of accurate data reporting. Discover the wisdom of our ancestors in crystallography research.

Download Presentation

Please find below an Image/Link to download the presentation.
The content on the website is provided AS IS for your information and personal use only. It may not be sold, licensed, or shared on other websites without obtaining consent from the author. Download presentation by click this link. If you encounter any issues during the download, it is possible that the publisher has removed the file from their server.
E N D
Presentation Transcript
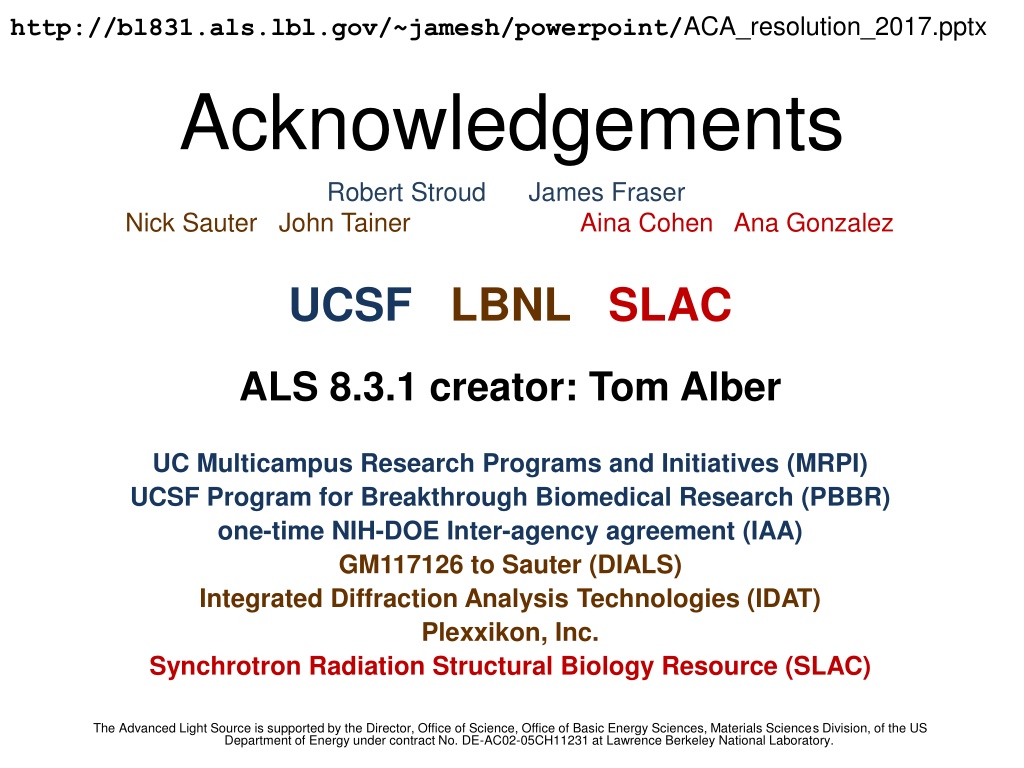
http://bl831.als.lbl.gov/~jamesh/powerpoint/ACA_resolution_2017.pptxhttp://bl831.als.lbl.gov/~jamesh/powerpoint/ACA_resolution_2017.pptx Acknowledgements Robert Stroud James Fraser Nick Sauter John Tainer Aina Cohen Ana Gonzalez UCSF LBNL SLAC ALS 8.3.1 creator: Tom Alber UC Multicampus Research Programs and Initiatives (MRPI) UCSF Program for Breakthrough Biomedical Research (PBBR) one-time NIH-DOE Inter-agency agreement (IAA) GM117126 to Sauter (DIALS) Integrated Diffraction Analysis Technologies (IDAT) Plexxikon, Inc. Synchrotron Radiation Structural Biology Resource (SLAC) The Advanced Light Source is supported by the Director, Office of Science, Office of Basic Energy Sciences, Materials Sciences Division, of the US Department of Energy under contract No. DE-AC02-05CH11231 at Lawrence Berkeley National Laboratory.
DOE BER Structural Biology Portal https://www.berstructuralbioportal.org/ssrl/
What is resolution ? 1. Where do I cut my data? 2. What do I give to refinement? 3. What can I claim in my paper?
Rmerge at the resolution limit 0.6 Average outer-shell Rmerge 0.5 0.4 0.3 0.2 0.1 0 1993 1995 1998 2001 2004 2006 2009 2012 2014 2017 Year
Expected Rmerge as Iobs 0 obs I I = R merge obs I
Averaging Gaussian error 0.5 0.4 average 0.3 Average value 0.2 0.1 0 0.45 -0.1 histogram 0.4 0.35 gaussian 0.3 -0.2 0.25 0.2 0.15 -0.3 0.1 0.05 0 -4 -3 -2 -1 0 1 2 3 4 -0.4 1 10 100 1000 10000 100000 Number of samples averaged
Averaging Gauss/Gauss error 3 average 2 1 Average value 0 -1 -2 0.45 0.4 histogram 0.35 gaussian 0.3 -3 0.25 0.2 0.15 0.1 -4 0.05 0 -0.05 -4 -3 -2 -1 0 1 2 3 4 -5 1 10 100 1000 10000 100000 1000000 Number of samples averaged
Take-home lesson: R factors are undefined as Iobs 0 Report as in outer bin
Wisdom of our ancestors Publication criterion for chemical crystallography: R1 < 2*Rsigma R1 Rsigma = < (I)>/<I> = Fo vs Fc for I/ (I) > 3 There are no PDB entries that pass this test!
Where do I cut my data? Too optimistic: add nothing but noise Too pessimistic: series-termination error Happy medium? Simulate: Random atoms, compute F2 Add Gaussian noise, RMS = 1 Truncate Calculate map with perfect phases Subtract right map, RMS difference
Optimal resolution cutoff 0.02 total error series termination noise in data 0.018 0.016 Error in map (rms e-) 0.014 0.012 0.01 0.008 0.006 0.004 0.002 0 0.8 0.9 1 1.1 1.2 1.3 Resolution cutoff ( )
Optimal resolution cutoff 0.19 total error CC1/2 CCtrue Correlation Coefficient 0.14 0.09 0.04 -0.01 0.8 0.9 Resolution cutoff ( ) 1 1.1
Optimal resolution cutoff 0.19 total error CC1/2 CCtrue CC* Correlation Coefficient 0.14 0.09 0.04 -0.01 0.8 0.9 Resolution cutoff ( ) 1 1.1
Wilson Plot 100000 2 True F xdsconv truncate 10000 1000 log( intensity ) 100 10 1 0.1 0.01 0.001 0.0001 0.00001 0.000001 2.2 1.6 1.3 1.1 1.0 0.9 0.85 0.8 0.75 0.7 8 0 0.05 0.1 0.15 0.2 0.25 0.3 0.35 0.4 0.45 0.5 resolution ( )
Optimum resolution cutoff is: 0.0 Practically: CC1/2 0
What can I claim in my paper? RMS error in coordinate position? Fun fact: (F) are NOT used in maximum-likelihood refinement Bricogne (1988). Acta Cryst. A44, 517-45 Read (1990). Acta Cryst. A46, 900-12 Luzzati (1952). Acta Cryst. 5, 802-10
Its in the REFMAC log! Resolution limits = 55.556 1.640 Number of used reflections = 13592 Percentage observed = 96.6545 Percentage of free reflections = 5.1500 Overall R factor = 0.2078 Free R factor = 0.2622 Overall weighted R factor = 0.2006 Free weighted R factor = 0.2470 Overall correlation coefficient = 0.9358 Free correlation coefficient = 0.8989 Cruickshanks DPI for coordinate error= 0.1281 DPI based on free R factor = 0.1305 Overall figure of merit = 0.8292 ML based su of positional parameters = 0.0800 ML based su of thermal parameters = 2.2731
Its in the phenix log! |--(resolution: 1.53 - 38.61 A, n_refl.=31822 (all), 4.94 % free)------------| | | | r_work= 0.2205 r_free= 0.2135 coordinate error (max.-lik. estimate): 0.02 A | | | | x-ray target function (ml) for work reflections: 4.834539 | |-----------------------------------------------------------------------------|
optical definition of resolution 1.4 atom1 atom2 sum 1.2 Electron density (e-/ ) 1 0.8 0.6 0.4 0.2 0 -2 -1.5 -1 -0.5 0 0.5 1 1.5 2 Position ( )
optical definition of resolution 1.4 atom1 atom2 sum 1.2 Electron density (e-/ ) 1 0.8 0.6 0.4 0.2 0 -2 -1.5 -1 -0.5 0 0.5 1 1.5 2 Position ( )
optical definition of resolution 1.4 atom1 atom2 sum 1.2 Electron density (e-/ ) 1 0.8 0.6 0.4 0.2 0 -2 -1.5 -1 -0.5 0 0.5 1 1.5 2 Position ( )
optical definition of resolution 1.4 atom1 atom2 sum 1.2 Electron density (e-/ ) 1 0.8 0.6 0.4 0.2 0 -2 -1.5 -1 -0.5 0 0.5 1 1.5 2 Position ( )
optical definition of resolution 1.4 atom1 atom2 sum 1.2 Electron density (e-/ ) 1 0.8 0.6 0.4 0.2 0 -2 -1.5 -1 -0.5 0 0.5 1 1.5 2 Position ( )
optical definition of resolution 1.4 atom1 atom2 sum 1.2 Electron density (e-/ ) 1 0.8 0.6 0.4 0.2 0 -2 -1.5 -1 -0.5 0 0.5 1 1.5 2 Position ( )
optical definition of resolution 1.4 atom1 atom2 sum 1.2 Electron density (e-/ ) 1 0.8 0.6 0.4 0.2 0 -2 -1.5 -1 -0.5 0 0.5 1 1.5 2 Position ( )
optical definition of resolution 1.4 atom1 atom2 sum 1.2 Electron density (e-/ ) 1 0.8 0.6 0.4 0.2 0 -2 -1.5 -1 -0.5 0 0.5 1 1.5 2 Position ( )
optical definition of resolution 1.4 atom1 atom2 sum 1.2 Electron density (e-/ ) 0.849 FWHM 1 0.8 0.6 FWHM 0.4 0.2 0 -2 -1.5 -1 -0.5 0 0.5 1 1.5 2 Position ( )
optical definition of resolution 12 atom1 atom2 sum 10 Electron density (e-/ ) map sharpening 8 6 4 2 0 -2 -1.5 -1 -0.5 0 0.5 1 1.5 2 Position ( )
optical definition of resolution 13 atom1 atom2 sum 11 realistic 9 Electron density (e-/ ) map sharpening 7 5 3 1 -1 -3 -5 -2 -1.5 -1 -0.5 0 0.5 1 1.5 2 Position ( )
optical definition of resolution 0.8 electron density error bar 0.7 Electron density (e-/ ) 0.6 0.5 84% 0.4 98% 0.3 99.9% 0.2 0.1 0 -4 -3 -2 -1 0 1 2 3 4 Position ( )
"error bar" for electron density Refinement Against Perturbed Input Data 1.1 2Fo-Fc 1 sigma(2Fo-Fc) 0.9 0.8 electron density (e-/ 3) 0.7 0.6 0.5 0.4 0.3 0.2 0.1 0 -0.1 0 0.2 0.4 0.6 0.8 1 fractional coordinate Lang et al. (2014) PNAS USA111, 237-242.
Map error vs RMS Fo-Fc 0.3 pdb entries x=y 0.25 Empirical error (RMS e-/ 3) 0.2 0.15 0.1 0.05 0 0 0.05 0.1 0.15 0.2 0.25 RMS value of mFo-DFc map (e-/ 3)
3resolution of model from map 7 RMS map error (e-/ 3) Atomic Resolution ( ) 6 0.1 0.125 0.2 5 4 3 2 1 0 0 10 20 30 40 50 60 70 refined atomic B factor (8 ux2)
Its in the FFT log! echo labin F1=FOFCWT PHI=PHFOFCWT | fft hklin refine_out.mtz Number of columns, rows, sections ............... 160 132 264 Map mode ........................................ 2 Start and stop points on columns, rows, sections 0 159 0 131 0 263 Grid sampling on x, y, z ........................ 132 160 264 Cell dimensions ................................. 43.0000 52.6100 89.1200 90.0000 90.0000 90.0000 Fast, medium, slow axes ......................... Y X Z Minimum density ................................. -0.09104 Maximum density ................................. 0.35006 Mean density .................................... 0.00000 Rms deviation from mean density ................. 0.01954 Space-group ..................................... 19 Number of titles ................................ 1
B factors are in the PDB file ATOM 122 N LEU A 13 -3.244 25.808 19.998 1.00 16.96 N ATOM 123 CA LEU A 13 -2.877 25.448 21.355 1.00 15.29 C ATOM 124 C LEU A 13 -2.792 23.966 21.561 1.00 17.54 C ATOM 125 O LEU A 13 -1.814 23.493 22.143 1.00 16.35 O ATOM 126 CB LEU A 13 -3.907 26.164 22.268 1.00 18.72 C ATOM 127 CG LEU A 13 -3.577 25.982 23.738 1.00 21.19 C ATOM 128 CD1 LEU A 13 -2.283 26.820 24.019 1.00 19.43 C ATOM 129 CD2 LEU A 13 -4.702 26.474 24.639 1.00 24.65 C ATOM 130 N SER A 14 -3.677 23.149 20.979 1.00 15.96 N ATOM 131 CA SER A 14 -3.646 21.711 21.061 1.00 18.26 C ATOM 132 C SER A 14 -2.373 21.203 20.360 1.00 18.71 C ATOM 133 O SER A 14 -1.747 20.315 20.930 1.00 17.47 O ATOM 134 CB SER A 14 -4.875 21.077 20.419 1.00 17.62 C ATOM 135 OG ASER A 14 -4.825 19.665 20.388 0.50 20.89 O ATOM 136 OG BSER A 14 -6.027 21.408 21.164 0.50 18.67 O ATOM 137 N LYS A 15 -2.045 21.772 19.215 1.00 18.03 N ATOM 138 CA LYS A 15 -0.799 21.361 18.555 1.00 18.12 C ATOM 139 C LYS A 15 0.446 21.707 19.351 1.00 18.81 C ATOM 140 O LYS A 15 1.400 20.948 19.411 1.00 17.77 O ATOM 141 CB LYS A 15 -0.700 22.034 17.177 1.00 14.49 C ATOM 142 CG LYS A 15 -1.727 21.368 16.256 1.00 16.12 C ATOM 143 CD LYS A 15 -1.663 22.147 14.936 1.00 19.40 C ATOM 144 CE ALYS A 15 -2.725 21.614 13.986 0.50 17.42 C
What is resolution ? CC1/2 0 1. Where do I cut my data? Rmerge meaningless as Iobs 0 Straighten Wilson Plot for maps? 2. What do I give to refinement? Karplus-Diederichs paired refinement report R1 (F) only matters for phasing 3. What can I claim in my paper? Retain historical relevance? I/ = 3 Report 3 resolution for model?
Resolution vs RMS Fo-Fc 0.3 0.25 Map error (RMS e-/ ) 0.2 0.15 0.1 0.05 0 1 1.5 2 2.5 3 3.5 Reported Resolution ( )
"error bar" for electron density 0.4 Fobs 0.3 structure factor (e-/cell) 0.2 0.1 0 0 5 10 15 20 spot index Lang et al. (2014) PNAS USA111, 237-242.
"error bar" for electron density 0.4 1.1 Fobs Fcalc 1 Fcalc 0.9 0.3 0.8 structure factor (e-/cell) electron density (e-/ 3) 0.7 0.6 0.5 0.2 0.4 0.3 0.2 0.1 0.1 0 -0.1 0 0 5 10 15 20 0 0.2 0.4 0.6 0.8 1 spot index fractional coordinate Lang et al. (2014) PNAS USA111, 237-242.
"error bar" for electron density 0.4 1.1 Fcalc Fobs 1 Fcalc 2Fo-Fc 0.9 0.3 0.8 structure factor (e-/cell) electron density (e-/ 3) 0.7 0.6 0.5 0.2 0.4 0.3 0.2 0.1 0.1 0 -0.1 0 0 5 10 15 20 0 0.2 0.4 0.6 0.8 1 spot index fractional coordinate Lang et al. (2014) PNAS USA111, 237-242.
"error bar" for electron density 0.4 1.1 Fkicked Fcalc 1 Fcalc 0.9 0.3 0.8 structure factor (e-/cell) electron density (e-/ 3) 0.7 0.6 0.5 0.2 0.4 0.3 0.2 0.1 0.1 0 -0.1 0 0 5 10 15 20 0 0.2 0.4 0.6 0.8 1 spot index fractional coordinate Lang et al. (2014) PNAS USA111, 237-242.
"error bar" for electron density 0.4 1.1 Fkicked Fcalc 1 Fcalc 0.9 0.3 0.8 structure factor (e-/cell) electron density (e-/ 3) 0.7 0.6 0.5 0.2 0.4 0.3 0.2 0.1 0.1 0 -0.1 0 0 5 10 15 20 0 0.2 0.4 0.6 0.8 1 spot index fractional coordinate Lang et al. (2014) PNAS USA111, 237-242.
"error bar" for electron density 0.4 1.1 Fkicked Fcalc 1 Fcalc 2Fo-Fc 0.9 0.3 0.8 structure factor (e-/cell) electron density (e-/ 3) 0.7 0.6 0.5 0.2 0.4 0.3 0.2 0.1 0.1 0 -0.1 0 0 5 10 15 20 0 0.2 0.4 0.6 0.8 1 spot index fractional coordinate Lang et al. (2014) PNAS USA111, 237-242.
"error bar" for electron density 0.4 1.1 Fkicked Fcalc 1 Fcalc 2Fo-Fc 0.9 0.3 0.8 structure factor (e-/cell) electron density (e-/ 3) 0.7 0.6 0.5 0.2 0.4 0.3 0.2 0.1 0.1 0 -0.1 0 0 5 10 15 20 0 0.2 0.4 0.6 0.8 1 spot index fractional coordinate Lang et al. (2014) PNAS USA111, 237-242.
"error bar" for electron density 0.4 1.1 Fkicked Fcalc 1 Fcalc 2Fo-Fc 0.9 0.3 0.8 structure factor (e-/cell) electron density (e-/ 3) 0.7 0.6 0.5 0.2 0.4 0.3 0.2 0.1 0.1 0 -0.1 0 0 5 10 15 20 0 0.2 0.4 0.6 0.8 1 spot index fractional coordinate Lang et al. (2014) PNAS USA111, 237-242.
"error bar" for electron density 0.4 1.1 Fkicked Fcalc 1 Fcalc 2Fo-Fc 0.9 0.3 0.8 structure factor (e-/cell) electron density (e-/ 3) 0.7 0.6 0.5 0.2 0.4 0.3 0.2 0.1 0.1 0 -0.1 0 0 5 10 15 20 0 0.2 0.4 0.6 0.8 1 spot index fractional coordinate Lang et al. (2014) PNAS USA111, 237-242.
"error bar" for electron density 0.4 1.1 Fkicked Fcalc 1 Fcalc 2Fo-Fc 0.9 0.3 0.8 structure factor (e-/cell) electron density (e-/ 3) 0.7 0.6 0.5 0.2 0.4 0.3 0.2 0.1 0.1 0 -0.1 0 0 5 10 15 20 0 0.2 0.4 0.6 0.8 1 spot index fractional coordinate Lang et al. (2014) PNAS USA111, 237-242.
"error bar" for electron density 0.4 1.1 Fcalc Fobs 1 Fcalc 2Fo-Fc 0.9 0.3 0.8 structure factor (e-/cell) electron density (e-/ 3) 0.7 0.6 0.5 0.2 0.4 0.3 0.2 0.1 0.1 0 -0.1 0 0 5 10 15 20 0 0.2 0.4 0.6 0.8 1 spot index fractional coordinate Lang et al. (2014) PNAS USA111, 237-242.
"error bar" for electron density 0.4 1.1 2Fo-Fc Fobs 1 sigma(2Fo-Fc) Fcalc 0.9 0.3 0.8 structure factor (e-/cell) electron density (e-/ 3) 0.7 0.6 0.5 0.2 0.4 0.3 0.2 0.1 0.1 0 -0.1 0 0 5 10 15 20 0 0.2 0.4 0.6 0.8 1 spot index fractional coordinate Lang et al. (2014) PNAS USA111, 237-242.