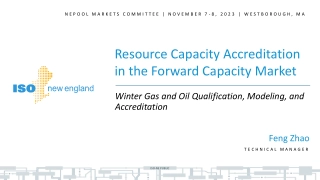
Update on Expected Capacity Scarcity Hours and Balancing Ratios for 2025-26
Presentation providing updates on the Expected Capacity Scarcity Hours and Balancing Ratios for the upcoming 2025-26 Capacity Commitment Period. The focus is on adjusting estimates based on new data for peak load scarcity hours, introducing a smoothing mechanism, and aligning with the recent FCM Parameters vote. Details include proposed effective dates, sources of CSC hours, and the importance of accurate estimations for various calculations.
Download Presentation

Please find below an Image/Link to download the presentation.
The content on the website is provided AS IS for your information and personal use only. It may not be sold, licensed, or shared on other websites without obtaining consent from the author. Download presentation by click this link. If you encounter any issues during the download, it is possible that the publisher has removed the file from their server.
E N D
Presentation Transcript
O C T O B E R 2 6 , 2 0 2 0 | M C T E L E C O N F E R E N C E R E V I S I O N 2 Expected Capacity Scarcity Condition (CSC) Hours and Capacity Balancing Ratios (BR) Updating the Estimates for the FCM Parameters Updates for the 2025-26 Capacity Commitment Period Kevin Coopey 4 1 3 - 5 4 0 - 4 2 5 0 | K C O O P E Y @ I S O - N E . C O M ISO-NE PUBLIC 1
Expected CSC hours and Expected BR Proposed Effective Date: June 1, 2025 (CCP 16) Expected CSC hours are based on three sources: peak load scarcity hours, transient scarcity hours, and winter scarcity hours This presentation updates the CSC and BR values to account for the most recent forecast of expected peak load scarcity hours: The October 2020 Power Supply Planning Committee presentation has new data on expected peak load scarcity hours for the fifteenth Forward Capacity Auction (FCA 15) ISO is not revising the estimates of the transient and winter hours ISO-NE is also proposing to apply a smoothing mechanism to the peak load expected scarcity hour estimates for purposes of calculating the Net Cost of New Entry (CONE), Offer Review Trigger Prices (ORTPs), and Performance Payment Rate (PPR) values In recognition of the November MC vote on the FCM Parameters, we are bringing this information forward as expeditiously as possible ISO-NE PUBLIC 2
UPDATES TO THE PEAK LOAD SCARCITY HOUR ESTIMATE Latest Data and Proposed Value for CCP 16+ FCM Parameters ISO-NE PUBLIC 3
Annual Peak Load CSC Updating Process and Proposal The annual peak load scarcity hours estimate is (normally) updated each fall, after the Installed Capacity Requirement (ICR) process is completed This is the earliest in the annual auction process that the peak load scarcity hour estimates can be generated Consistent with past practice (2016 FCM Parameters updates for FCA 11), ISO is updating the CSC values, in light of the latest peak load scarcity hours estimates discussed at the October 9, 2020 Power Supply Planning Committee (PSPC), before finalizing Net CONE and related FCM Parameters With the benefit of several years of data, we are proposing a smoothing mechanism for the updated peak load CSC values to be used for the final Net CONE, PPR, and ORTP values ISO-NE PUBLIC 4
Historical Peak Load Scarcity Estimates Are Showing Increased Volatility Fundamentally, an at criterion market parameter should be relatively stable Both the FCA 14 and FCA 15 peak load at criterion scarcity hour estimates show a significant Year-over-Year (YoY) change Capacity Estimated CSC Hours 11.3 10.0 8.2 14.1 7.9 YoY Commitment Period 2020-21 (FCA 11) 2021-22 (FCA 12) 2022-23 (FCA 13) 2023-24 (FCA 14) 2024-25 (FCA 15) -1.3 -1.8 5.9 -6.2 These YoY changes result (primarily) from the updated load forecast and variation in the probability of intermediate high load levels associated with reserve shortage conditions See slides 12-13 of the October 9, 2020 PSPC presentation ISO-NE PUBLIC 5
Smoothing the Peak Load Estimated Scarcity Hours In light of this volatility, the ISO proposes to use a four-year moving average to establish the expected peak load scarcity hours for the FCM Parameters Four years aligns with the load forecast horizon; for example, the load forecast used in GE-MARS for the FCA 15 scarcity hour estimate was finalized in March 2020 There is minimal difference between a three, four, or five-year average: Capacity Level 3-yr Avg 4-yr Avg 5-yr Avg Net ICR (NICR) 10.1 10.1 10.3 The proposed four-year average will incorporate the most recent GE- MARS data available (i.e., includes the FCA 15 estimates) In the Net CONE calculation for FCA 16, total expected annual scarcity hours, including transient (0.8h) and winter (0.4h), becomes 10.1 + 0.8 + 0.4 = 11.3 hours ISO is not updating the transient and winter expected scarcity hours ISO-NE PUBLIC 6
UPDATES TO THE EXPECTED BALANCING RATIO FOR NET CONE ISO-NE PUBLIC 7
Updated Expected Balancing Ratio Updating the peak load scarcity hours requires that the expected at-criterion balancing ratio be adjusted Lowering the peak load scarcity s share of total scarcity hours decreases the expected balancing ratio The corresponding updated annual balancing ratio is 84.7% No change is being made to the underlying balancing ratios for each CSC type (far-right column); only the number of peak load hours used to calculate the weighted average have been updated Season Peak Load Transient Winter Total Scarcity Hours Balancing Ratio 10.1 0.8 0.4 11.3 86.9% 62.5% 72.5% 84.7% Note: Values may reflect rounding ISO-NE PUBLIC 8
UPDATES TO THE EXPECTED SCARCITY HOURS AND BALANCING RATIO FOR ORTP ISO-NE PUBLIC 9
ORTP Expected Peak Load Scarcity Hours The smoothing mechanism is also being applied to the (MW- dependent) estimates of expected peak load scarcity hours for ORTPs Recall: The OTRP values are intended to apply mitigation reviews suitable for projected near-term conditions (i.e., FCA 16), not at- criterion The revised, smoothed ORTP peak load scarcity hour values will continue to use the most recent data to adjust for excess CSO MW 791 MW, based on the 2019 Regional System Plan and FCA 14 results (as noted in the August Markets Committee presentation) ISO-NE PUBLIC 10
Updated ORTP Expected Peak Load Scarcity Hours ORTP peak load CSCs hours are estimated using the four-year moving average of MW-dependent peak load expected scarcity hours calculated using GE MARs Capacity Level NICR + 2000 NICR + 1600 NICR + 1200 NICR + 800 NICR + 400 NICR 2017 3.8 4.8 5.9 7.1 8.4 10.0 2018 2.8 3.6 4.6 5.6 6.8 8.2 2019 2.4 3.5 5.0 7.1 10.1 14.1 2020 2.1 2.8 3.7 4.8 6.2 7.9 Average 2.8 3.7 4.8 6.2 7.9 10.1 Linear interpolation for 791 MW using the 4-yr average data yields expected peak load CSCs of 6.2 hours annually Revised total annual expected scarcity hours for FCA16 ORTPs are 6.2 + 0.8 + 0.4 = 7.4 hours ISO is not updating the transient and winter expected scarcity hours Note: Values may reflect rounding ISO-NE PUBLIC 11
UPDATES TO THE EXPECTED SCARCITY HOURS AND BALANCING RATIO FOR ORTP ISO-NE PUBLIC 12
From August 2020 MC Presentation ORTP Capacity Balancing Ratio The ORTP expected balancing ratio should reflect the expected system condition for FCA16 Higher quantity of CSO MW increases the denominator in the BR calculation, thereby lowering the expected BR The at-criterion BRs are scaled down by the ratio of the capacity surplus to estimate the ORTP BR values The at-criterion BR s include the modifications discussed in July 2020 that replace the denominator with the Net ICR and account for the recently filed changes to energy efficiency The capacity ratio is calculated using the same values as the expected scarcity hours Capacity Excess Ratio = 33,165 MW / 33,956 MW = 98% (continued next slide) ISO-NE PUBLIC 13
Updated ORTP Capacity Balancing Ratio Results The 98% capacity excess ratio is applied to each type of scarcity hour s balancing ratio No change is being made to the underlying balancing ratio inputs (far-right column), only to the peak load hours used to calculate the weighted average have been updated Season Scarcity Hours At Criteria BR ORTP BR Peak Load 6.2 86.9% 84.9% Transient 0.8 62.5% 61.0% Winter 0.4 72.5% 70.8% Total 7.4 81.6% The updated scarcity hour-weighted average ORTP BR is 81.6% Note: Values may reflect rounding ISO-NE PUBLIC 14
SUMMARY OF UPDATES ISO-NE PUBLIC 15
Summary of Updates to CSC and BR for Net CONE August MC: CSC Type Peak Load Transient Winter CSC Hours 14.1 0.8 0.4 15.3 Balancing Ratio 86.9% 62.5% 72.5% 85.2% Updated: CSC Type Peak Load Transient Winter CSC Hours 10.1 0.8 0.4 11.3 Balancing Ratio 86.9% 62.5% 72.5% 84.7% ISO-NE PUBLIC 16
Summary of Updates to CSC and BR for ORTP August MC: CSC Type Peak Load Transient Winter CSC Hours 7.2 0.8 0.4 8.4 Balancing Ratio 84.9% 61.0% 70.8% 81.9% Updated: CSC Type Peak Load Transient Winter CSC Hours 6.2 0.8 0.4 7.4 Balancing Ratio 84.9% 61.0% 70.8% 81.6% ISO-NE PUBLIC 17
Conclusion Fundamentally, the expected annual scarcity hours in a system at criterion should be relatively stable Both the FCA 14 and FCA 15 peak load estimated scarcity hours showed considerable volatility Using a four-year moving average of expected scarcity hours smooths the peak load scarcity hours, to provide a more reasonable estimate of expected CSC hours applicable to FCM Parameters for the next three CCPs (i.e., until the next triennial updates) ISO-NE PUBLIC 18
Stakeholder Schedule Stakeholder Committee and Date Scheduled Project Milestone Markets Committee July 14, 2020 Initial presentation of methodology and results Markets Committee August 11, 2020 Continued discussion Markets Committee October 26, 2020 Revised values and discussion ISO-NE PUBLIC 19
Acronyms Used in this Presentation BR = Capacity Balancing Ratio CONE = Cost of New Entry CSC = Capacity Scarcity Condition FCA = Forward Capacity Auction ICR = Installed Capacity Requirement ORTP = Offer Review Trigger Prices PSPC = Power Supply Planning Committee ISO-NE PUBLIC 21
APPENDIX Capacity Scarcity Conditions and Balancing Ratio based on FCA 15 peak load hours, without application of four-year average Net CONE ORTPs ISO-NE PUBLIC 22
Updates to CSC and BR for Net CONE based on FCA 15 Peak Load Scarcity Hours The table below summarizes the CSC hours and balancing ratio based upon the most recent forecast of expected peak load scarcity hours for FCA15 CSC Type Peak Load Transient Winter CSC Hours 7.9 0.8 0.4 9.1 Balancing Ratio 86.9% 62.5% 72.5% 84.1% ISO-NE PUBLIC 23
Updates to CSC and BR for ORTPs based on FCA 15 Peak Load Scarcity Hours The table below summarizes the CSC hours and balancing ratio based upon the most recent forecast of expected peak load scarcity hours for FCA15 CSC Type Peak Load Transient Winter CSC Hours 4.8 0.8 0.4 6.0 Balancing Ratio 84.9% 61.0% 70.8% 80.8% ISO-NE PUBLIC 24


