Basic Education Strategic Plan 2020-2025 & Performance Plan 2022/23 Presentation
The presentation outlines the purpose, scope, and background of the Basic Education sector, aligning with government priorities. It covers the strategic plan for 2020-2025 and the annual performance plan for 2022/23.
Download Presentation

Please find below an Image/Link to download the presentation.
The content on the website is provided AS IS for your information and personal use only. It may not be sold, licensed, or shared on other websites without obtaining consent from the author.If you encounter any issues during the download, it is possible that the publisher has removed the file from their server.
You are allowed to download the files provided on this website for personal or commercial use, subject to the condition that they are used lawfully. All files are the property of their respective owners.
The content on the website is provided AS IS for your information and personal use only. It may not be sold, licensed, or shared on other websites without obtaining consent from the author.
E N D
Presentation Transcript
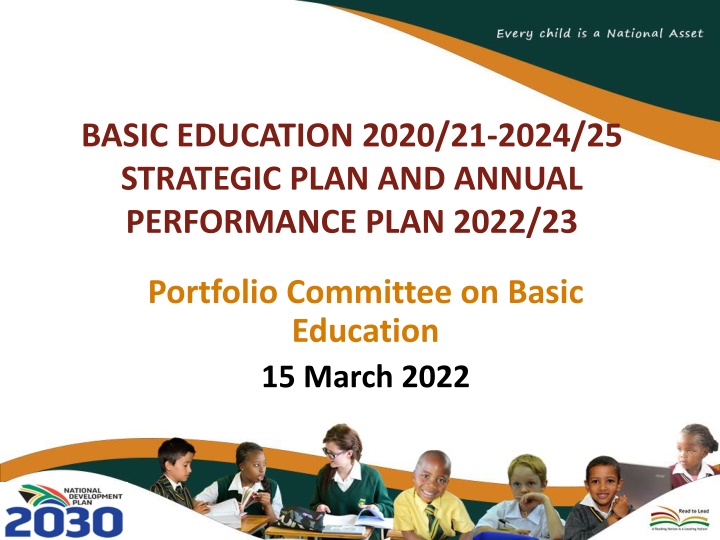
BASIC EDUCATION 2020/21-2024/25 STRATEGIC PLAN AND ANNUAL PERFORMANCE PLAN 2022/23 Portfolio Committee on Basic Education 15 March 2022 1
PRESENTATION OUTLINE Purpose Size and Shape of the Basic Education Sector Background Government priorities 2019-2024 Medium-Term Strategic Framework (MTSF) and Education Sector Priorities Action Plan to 2024: Towards the Realisation of Schooling 2030 Council of Education Ministers (CEM) priorities State of the Nation Address (SoNA) 2021/ 2022 Progress on selected deliverables (Including Infrastructure, Learning/Materials) ECD Function Shift Annual plans towards long term outcomes. Linking MTSF outcomes to APP approach and Strategic outcomes The DBE APP 2022/23 development process DBE SP 2020/21-2024/25 The DBE APP 2022/23 2022 Budget Allocation Recommendation 2
PURPOSE To present the Department of Basic Education (DBE) Annual Performance 2022/23 to the Portfolio on Basic Education. Plan (APP) 3
SIZE AND SHAPE OF THE BASIC EDUCATION SECTOR, 2021 Sector Learners Educators Schools Size of the Schooling System: Public 405 050 22 740 12 706 157 Independent 703 092 42 073 2 154 Learners: 13 409 249 Educators: 447 123 Schools: 24 894 Total 13 409 249 447 123 24 894 Learners Educators Schools Official languages 9% 9% 5% English, isiZulu, isiXhosa, isiNdebele, Afrikaans, siSwati, Sepedi, Sesotho, Setswana, Tshivenda, Xitsonga, South African Sign Language 95% 91% 91% Public Independent Public Independent Public Independent 4
BACKGROUND The presentation outlines the approach to Government-wide NDP priorities and the Education sector priorities based on the NDP 2030, MTSF 2019-2024 and Action Plan to 2024. The intention is to ensure programme activities in the sector to align with medium and long- term goals. The Strategic Plan 2020/21-2024/25 is anchored on the Government s long-term plan; the National Development Plan 2030: Our future make it work, the MTSF 2019-2024 and the Action Plan to 2024. The Annual Performance Plan (APP) sets out what the Department intends doing in the financial year and during the Medium-Term Expenditure Framework (MTEF) period to implement its Strategic Plan. In fulfilling its legal obligation, the Department must produce and table an APP annually to Parliament. The Strategic Plan should cover a period of at least five years and can be amended during the five-year period it covers. The APP 2022/23represents the third year activities towards achieving the objectives contained in the DBE Strategic Plan 2020/21-2024/25. 5
LEARNING LOSSES Since its outbreak two years ago, the COVID-19 pandemic has disrupted education systems globally, affecting the most vulnerable learners the hardest. It has increased inequalities and aggravated a pre-existing education crisis. Enrolment in the first quarter of 2021 was around 50 000 (0.4%) lower than expected. The problem concentrated in lower grades. 54% of contact time was lost in 2020 due to closures and rotations. In the second half of 2021, 22% of contact was time lost due to rotations and regular absenteeism. These averages hide huge inequalities across grades and schools. In historically disadvantaged schools, around 70% of a year s worth of learning was lost in 2020. For every day of schooling lost, around 1.3 days of learning are lost. 6
KEY GOVERNMENT PRIORITIES The MTSF 2019 2024 translates the ruling party s electoral mandate into government s priorities over a five-year period. The Basic Education is critical in priority 2,3, 4 and 6: Priority 1: A capable, ethical and developmental state. Priority 2: Economic transformation and job creation. Priority 3: Education, skills and health. Priority 4: Consolidating the social wage through reliable and quality basic services. Priority 5: Spatial integration, human settlements and local government. Priority 6: Social cohesion and safe communities. Priority 7: A better Africa and world. 7
2019-2024 MEDIUM-TERM STRATEGIC FRAMEWORK (MTSF) AND EDUCATION SECTOR PRIORITIES 8
2019 2024 MEDIUM TERM STRATEGIC FRAMEWORK (MTSF) OUTCOMES Outcome 1: Improved school-readiness of children. Outcome 2: 10-year-old learners enrolled in publicly funded schools read for meaning. Outcome 3: Youths better prepared for further studies and the world of work beyond Grade 9. Outcome 4: Youths leaving the schooling system more prepared to contribute towards a prosperous and equitable South Africa. Outcome 5: School physical infrastructure and environment that inspires learners to learn and teachers to teach. 9
ACTION PLAN TO 2024: TOWARDS THE REALISATION OF SCHOOLING 2030 10
ACTION PLAN TO 2024 The Action Plan to 2024: Towards the Realisation of Schooling 2030 is the sector plan for basic education. It has been reviewed and strengthened for the 2020-2024 planning cycle. The Action Plan is based on 27 national goals that are intended to improve basic education across all levels. 13 of these goals, are output goals, dealing with better school results and better enrolment of learners in schools. The remaining 14 goals deal with things that must happen for the output goals to be realised. 11
Action Plan to 2024: Towards the realisation of Schooling 2030 (access, redress, equity, inclusivity, quality, & efficiency) Goals 1 to 13: Improved Learning Outcomes - Improve learning outcomes in Language, Mathematics and Science as measured in Grades 3, 6, 9 and 12 Ensure full access to compulsory schooling Decrease grade repetition and retention Improve access to Further Education and Training (FET) colleges Improve quality of Grade R - - Goals 14 to 27: Interventions - the how to Improve Learning Outcomes - - Apex priorities during the pandemic Early Childhood Development Infrastructure Learning Losses 12
COUNCIL OF EDUCATION MINISTERS (CEM) PRIORITIES FOR THE SIXTH ADMINISTRATION These priorities were approved by the Council of Education Ministers to lay a solid foundation for quality education, in support of improved reading and learning outcomes: 1. Improving foundational skills of Numeracy and Literacy, especially reading which should be underpinned by a Reading Revolution. 4. Urgent implementation of two years of ECD before Grade 1, and the migration of the 0 - 4 year olds from the Department of Social Development to the Department of Basic Education. 2. Immediate implementation of a curriculum with skills and competencies for a changing world in all public schools (Three Stream Model, Fourth Industrial Revolution, Entrepreneurship, Focus Schools, etc.). 5. Complete an integrated Infrastructure Development Plan informed by infrastructure delivery and regular maintenance which is resourced. 3. Deal decisively with quality and efficiency through the implementation of standardised assessments to reduce failure, repetition, and drop out rates and introduce multiple qualifications such as the General Education Certificate before the Grade 12 exit qualification. 6. Work with Departments of Sport and Recreation, Arts and Culture, Health, and the South African Police Services to teach and promote Social Cohesion, Health and School Safety. 13
STATE OF THE NATION ADDRESS (SoNA) 14
SIGNIFICANCE OF SONA Presidential pronouncements set the key government priorities and deliverables for the year: In turn determine the priorities of the DBE and the basic education sector broadly. The pronouncements commit the DBE in public, to key activities and outcomes. Alignment to current annual plans of those key areas have tangible implications not only for the DBE but for the sector. 15
SONA 2021 Learning Disruptions and Issues affecting learners Schooling disruption placed a huge burden on learners, teachers and families. It is our priority for this year to regain lost time and improve educational outcomes, from the early years through to high school and post-school education and training. Early Childhood Development (ECD) and Early Learning Equally we need to give attention to issues affecting children including improving school-readiness, ECD planning and funding. 16
SONA 2022 School Infrastructure Government is introducing an innovative social infrastructure delivery mechanism to address issues that afflict the delivery of school infrastructure. The mechanism will address the speed, financing and funding, quality of delivery, mass employment and maintenance. Educator assistants Over half a million young people appointed as education assistants, making it the largest youth employment programme ever undertaken in our history. Learning losses As we return to normal educational activity, we will work harder to ensure that all learners and students get the quality education they need and deserve. 17
PROGRESS ON SELECTED KEY DELIVERABLES 18
ASIDI OVERALL PROGRESS PER SUB-PROGRAMME 28 Feb 2022 Cumulative ASIDI Summary from inception Subrogramme Description Number of schools per stage of progress Total Schools allocated Planning & Design Tender Construction <25% Construction <25- 50% Construction <51-75% Construction <76-99% Practical Completion Summary 3004 1 13 36 21 61 33 2839 Inappropriate Structures Total 328 1 - 14 8 10 5 290 Water Supply Total 1271 - 8 19 11 38 18 1177 Sanitation Total 1028 - 5 3 2 13 10 995 Electricity Supply Total 373 - - - - - - 373 Fencing Total 4 - - - - - - 4 19
NSC PERFORMANCE 2015 - 2021 100.0 81.3 78.2 76.4 76.2 75.1 72.5 70.7 80.0 60.0 40.0 20.0 0.0 2015 2016 2017 2018 2019 2020 2021 There was a significant increase in the number of full-time enrolments in 2021 academic year increasing from 610 484 in 2020 to 733 917 in 2021. This has resulted in an increase on candidates who wrote the 2021 NSC from 578 468 in 2020to 704 021 thereby a positive difference of 0.2%. 20
BACHELOR PASS (NUMBERS) PER PROVINCE 2021 70,000 61,856 55,848 60,000 50,000 40,000 31,384 28,072 26,125 30,000 21,044 20,000 13,971 13,875 10,000 3,856 0 21
SPECIAL NEEDS EDUCATION (SNE) LEARNERS WHO PASSED NSC IN 2021 The core promise of the National Development Plan s Vision 2030 is to leave no one behind, and the DBE aims to fulfil this commitment towards persons with disabilities. A total of 1 937 learners with Special Needs Education have achieved their NSC qualification. The following breakdown of qualification types have been achieved: Result Status Total Achieved Bachelor Achieved Diploma Achieved Higher Certificate 879 636 314 Achieved Endorsed Total Achieved 108 1 937 22
PROGRAMME 2 Workbooks 2021 Delivery Status: All Provinces(Volume 1 Grades 1 - 9 and Grade R) As at 1 March 2022 23
PROGRAMME 3 Funza Lushaka Placement rates PROVINCE PLACED UNPLACED ALLOCATION PLACEMENT% EASTERN CAPE 520 170 690 75% FREE STATE 242 83 325 74% GAUTENG 768 128 896 86% KWAZULU-NATAL 450 346 796 57% LIMPOPO 467 28 495 94% MPUMALANGA 336 126 462 73% NORTH WEST 253 16 269 94% NORTHERN CAPE 105 9 114 92% WESTERN CAPE 386 205 591 65% UNALLOCATED 0 7 7 0% GRAND TOTAL 3 527 1 118 4 645 76% Source: PERSAL December 2021 and PED reports 24
PROGRAMME 3 Allocated posts filled per province PERCENTAGE ALL FILLED-Q3 2021/22 PERCENTAGE ALL FILLED-Q2 2020/21 PERCENTAGE ALL FILLED-Q3 2020/21 NOT ALL FILLED ALL FILLED PROVINCE TOTAL EASTERN CAPE 1 956 3 192 5 148 62% 61% 66% FREE STATE 156 852 1 008 85% 78% 80% GAUTENG 333 1 906 2 239 85% 77% 85% KWAZULU-NATAL 1 717 4 166 5 883 71% 72% 46% LIMPOPO 812 2 915 3 727 78% 74% 38% MPUMALANGA 318 1 348 1 666 81% 77% 49% NORTH WEST 302 1 166 1 468 79% 71% 76% NORTHERN CAPE 28 527 555 95% 92% 94% WESTERN CAPE 152 1 358 1 510 90% 88% 94% TOTAL 5 774 17 430 23 204 75% 73% 60% Source: PERSAL, December 2021 25
PROGRAMME 3 Percentage of schools that had all their allocated posts filled by interval per province PROVINCE LESS THAN 50% 50%-74% 75%-99% 100% EASTERN CAPE 3% 4% 31% 62% FREE STATE 0% 1% 14% 85% GAUTENG 0% 0% 15% 85% KWAZULU-NATAL 1% 2% 27% 71% LIMPOPO 0% 1% 20% 78% MPUMALANGA 1% 1% 18% 81% NORTH WEST 0% 1% 20% 79% NORTHERN CAPE 0% 0% 5% 95% WESTERN CAPE 0% 1% 9% 90% TOTAL 1% 2% 22% 75% Source: PERSAL, December 2021 26
PROGRAMME 5 National School Nutrition Programme (NSNP) schools National School Nutrition Programme (NSNP) schools Provincial Performance Indicators EC Number of quintile 1 - 3 primary schools 4146 Number of quintile 1 - 3 secondary schools 789 Number of Special Schools 34 Total Number of Q1-3 Schools (Prim, Sec & Special) 4969 Number of quintile 4 - 5 primary schools 0 Number of quintile 4 - 5 secondary schools 0 Total Number of Q4-5 Schools (Prim & Special) 0 Total Number of schools reached 4969 FS GP KZN LP MP NC NW WC Total 565 650 3687 2375 1157 0 944 0 13524 253 303 1352 1295 452 0 364 0 4808 10 96 62 35 11 0 24 0 272 828 1049 5101 3705 1620 0 1332 0 18604 0 427 226 0 0 0 0 0 653 0 169 127 0 0 0 0 0 296 0 596 353 0 0 0 0 0 949 828 1645 5454 3705 1620 0 1332 0 19553 As at 31 December 2021 27
PROGRAMME 5 National School Nutrition Programme (NSNP) learners Provincial Performance Indicators EC Number of learners in quintile 1 - 3 primary schools 157190 383395 Number of learners in quintile 1 - 3 secondary schools 472 934 177621 Number of learners in Special Schools 9 611 Total Number of learners in Q1-3 Schools (Prim, Sec & Special) 1639735 564666 Number of learners in quintile 4 - 5 primary schools Number of learners in quintile 4 - 5 secondary schools Total Number of learners Q4-5 Schools (Prim & Special) Total Number of learners reached 1639735 564666 FS GP KZN LP MP NC NW WC Total 1 688809 1329807 1040877 594015 0 400824 0 5594917 73148 748827 578430 324013 0 125690 0 2500663 3 650 3 3529 13 932 8 519 1 992 0 3 695 0 74 928 795486 2092566 1627826 920020 0 530209 0 8170508 0 0 305 252 132 324 0 0 0 0 0 437 576 0 0 203 243 105 225 0 0 0 0 0 308 468 0 0 508 495 237 549 0 0 0 0 0 746 044 1303981 2330115 1627826 920020 0 530209 0 8916552 As at 31 December 2021 28
EARLY CHILDHOOD DEVELOPMENT (ECD) FUNCTION SHIFT 29
ECD FUNCTION SHIFT PROGRESS Service Delivery: Three (3) modalities for offering ECD Quality assurance, registration, capacity and systems urgently needed to achieve NDP goals Institutional arrangements and function shift The Minister and Department of Basic Education (DBE) will receive the responsibility for the ECD function on 1 April 2022 through the Proclamation signed by the President on 27 June 2021. The Minister of Finance tabled the function shift in the Medium Term Budget Policy Statement. Planning, data and information Census of all Early Learning Programmes: Collected data in 37 000 ECD programmes, provided services to 1.5 million children. Early Years Index and baseline assessment of Early Learning Programmes: The data collection was completed. Registration system under development, adapted for use. 30
ECD APPROACH TO Service Delivery: Three (3) modalities for offering ECD centre-based programmes home-based programmes play groups All ECD programmes supported by training of caregivers and those working in ECD centres and playgroups on the National Curriculum Framework (NCF); mobile ECD programmes and toy-libraries. 31
ECD FUNCTION SHIFT PROGRESS Coordination and change management critical Educational Management Information Systems (EMIS) Human Resources (HR) Funding expenditure review and funding Institutional arrangements and business process Capacity development and preparation in sector New function and new system New service delivery arrangements Reporting and coordination through HEDCOM and interprovincial forum New planning and other arrangements 32
ANNUAL PLANS TOWARDS LONG TERM OUTCOMES 33
APPROACH TO DBE OUTCOMES IN THE STRATEGIC AND ANNUAL PERFORMANCE PLANS The outcomes are broad to consolidate work contributed by the sector to encourage joint planning than working in silos by individual programmes to reflect the aspirations at an organisational level including the support to PEDs. The approach to outcomes assists with clustering delivery areas which relate to strategic outcomes thereby enabling new and emerging interventions to impact the Basic Education system meaningfully. The strategic delivery areas and outputsbridge the gap between medium-to-long- term outcomes, short-term annual outputs and indicators in describing the intended change for the education system. The process and approach to planning have applied the use of the Theory of Change to map the changes and impact of the Department, also using the Results Model to identify the critical success factors and deliverables of the sector in the implementation of the strategic intent. The DBE Strategic Outcomes have been slightly amended for strengthening. Amendments are reflected on Annexure A of the APP. 34
REVISIONS TO DBE OUTCOMES Original Outcomes Outcome 1: Maintain and develop the system of policies, including the curriculum and assessment, governing the basic education sector to advance a quality and inclusive, safe and healthy basic education system Outcome 2: Maintain and develop information and other systems which enable transformation and an efficient and accountable sector Outcome 3: Maintain and develop knowledge, monitoring and research functions to advance more evidence-driven planning, instruction and delivery Outcome 4: Advance the development of innovative and high-quality educational materials Revised Outcomes Outcome 1: Improved system of policies, including the curriculum and assessment, governing the basic education sector to advance a quality and inclusive, safe and healthy basic education system Outcome 2: Improved information and other systems which enable transformation and an efficient and accountable sector Outcome 3: Improved knowledge, monitoring and research functions to advance more evidence-driven planning, instruction and delivery Outcome 4: Advanced development of innovative and high-quality educational materials Outcome 5: Conduct strategic interventions to assist and develop provincial education systems Outcome 6: Communicate information to, and partner with relevant stakeholders in better ways Outcome 5: Enhanced strategic interventions to assist and develop provincial education systems Outcome 6: Improved communication of information and partnerships with stakeholders 35
LINK BETWEEN MTSF OUTCOMES AND DBE APP (DBE OUTCOMES AND OUTPUTS) MTSF Outcomes DBE Outcomes DBE Outputs linked Outcome 1: Improved school-readiness of children Outcome 1 Early Childhood Development fully migrated Outcome 2 Effective school administration monitored Determination of school readiness reported Outcome 3 Qualifications for Grade R practitioners assessed Outcome 2: 10-year- old learners enrolled in publicly funded schools read for meaning Outcome 1 Children/Learners with Profound Intellectual Disability supported Policy on Screening, Identification, Assessment and Support (SIAS) implemented Outcome 3 Implementation of reading norms monitored Implementation of Incremental Introduction to African Languages monitored Implementation of Early Grade Reading Assessment monitored Implementation of National Reading Plan monitored Availability of readers monitored Outcome 4 Workbooks provided to schools Lesson plans developed Outcome 5 Capacitated teachers in inclusion Learners admitted in public special schools Public special schools serving as resource centres monitored 36
LINK BETWEEN MTSF OUTCOMES AND DBE APP (DBE OUTCOMES AND OUTPUTS) MTSF Outcomes DBE Outcomes DBE Outputs linked Outcome 3: Youths better prepared for further studies and the world of work beyond Grade 9 Outcome 1 Entrepreneurship education implemented in schools Implementation of General Education Certificate Monitored Monitored pilot on Coding and Robotics curriculum Outcome 2 School Governing Bodies monitored Effective school management process Funza Lushaka bursaries awarded Funza Lushaka graduates placed Qualified teachers aged 30 and below appointed Test items developed Learning Outcomes assessed Outcome 4 Learner textbooks on Mathematics and EFAL provided Outcome 5 Performance management monitored Support to school principals rated District Directors capacitated Underperforming Schools Supported Teacher development conducted District Director forums conducted Outcome 6 37
LINK BETWEEN MTSF OUTCOMES AND DBE APP (DBE OUTCOMES AND OUTPUTS) MTSF Outcomes DBE Outcomes DBE Outputs linked Outcome 4: Youths leaving the schooling system more prepared to contribute towards a prosperous and equitable South Africa Increased Bachelor Level Passes Leaner health and wellness improved Informed stakeholders and partners Gender-based violence programmes implemented Outcome 1 Schools monitored on Implementation of CAPS Technical Occupational Stream Piloted Monitored pilot on Coding and Robotics curriculum Leaner subject passes in NSC/SC/NSC through SCMP obtained Implementation of National Curriculum Statement Monitored Outcome 2 School and learner performance on NSC produced Examination question papers set Teacher development monitored Focus schools established Officials in districts below the national benchmark mentored New schools completed School sanitation facilities provided School water facilities provided Monitored provision of nutritious meals Safe, active and social friendly schools Implementation of multi-grade toolkit monitored Utilisation of ICT resources monitored Special schools' access to electronic devices monitored Provision of ICT devices monitored Outcome 3 Outcome 5 Outcome 5: School physical infrastructure and environment that inspires learners to learn and teachers to teach Outcome 1 Outcome 3 Outcome 4 38
THE DBE APP 2022/23 DEVELOPMENT PROCESS 39
DBE APP Process Timeframe 2022/23 DBE APP DEVELOPMENT PROCESS Consultation with branches, DPME and NT submission with guidance from and consideration of: - Economic Reconstruction and Recovery Plan - National Annual Strategic plan (extract of MTSF plans to guide budget reprioritisation) NASP is a mechanism that improves the implementation of the MTSF, within annual cycles, instead of assuming that new and emerging government priorities are an "add on". Four (4) critical interventions for Priority 3 highlighted in the NASP: 1. Expand access to pre-schooling and improve readiness; 2. Accelerate implementation of Systemic Evaluation; 3. Support teacher training for a three-stream model; and 4. Improve school infrastructure through Accelerated School Infrastructure Delivery Initiative and Sanitation Appropriate For Education (SAFE). - District Development Model (DDM) which includes infrastructure projects. - Presidential Youth Employment Initiative June - 29 October 2021 2022 MTEF Preliminary allocations: 2022/23 - 2024/25 29 Nov 2021 Feedback on the draft APP 2022/23 was received from the DPME - including comments from Department of Women, Youth and Persons with Disabilities (DWYPD) and National Treasury 13 Dec 2021 Revised draft APP 2022/23 that was submitted to DPME and NT, and Cabinet requests from January meeting incorporated prior to tabling (10 March 2022) 4 Feb 2022 40
DPME FINDINGS ON DRAFT APP DPME FINDINGS Ensure National Annual Strategic Plan and allocated budget Ensure that the situational analysis is updated DBE COMMENTS The following areas that link to the NSAP are covered in the 2022/23 APP: o Early Childhood Development, Evaluation and Infrastructure The situational analysis has been updated in the APP to include damage to schools and, how learning losses were addressed for the 2021 matric class. The Explanation of Planned Performance has been re-arranged to show links between outputs, outcomes and the impact of the DBE. Programme Resource Considerations have been updated using the Estimates of National Expenditure (ENE). alignment to the Strengthen provided in the explanation for planned performance over the planning period and in the section on considerations Outdated data the information resource Comment indicated need to understand data sources which are produced by StatsSA. General Household Survey (GHS) has a 1 year time lag, hence the 2019 data used, and 2020 data was delayed. The last School Monitoring Survey (SMS) was conducted in 2017 and the next survey is in process in 2022. 41
DWYPD FINDINGS ON DRAFT APP FINDINGS APP is WYPD responsive, however the planned targets are stated as not applicable when defining targets for WYPD, therefore further work needs to be done for planned targets. DBE COMMENTS The DBE is working over time to disaggregation of information reported by programmes on beneficiaries e.g. women, youth and persons with disabilities. Indicators and targets have been identified in the 2022/23 APP for disaggregation with programme managers and the number will be expanded over time. The Department has undertaken a comprehensive employment systems review, to ensure that disability equity targets are met. Work to improve national consultations with identified sectors is ongoing especially in Programme 2 and 5. Internal Environment: The institutional capacity to mainstream women, youth and persons with disabilities needs continuous increases. The institution consultation with women, youth and disability rights sectors is work in progress and it needs to continue Measuring Performance: Disaggregated targets programme 1, service providers should be responsive to WYPD. Employment Equity Act, the target of Senior Managers should be improved. The department to improve the numbers of women in SMS and set a higher target. Disaggregated data mustbe made available and accessible for data users. The Department will ensure that in advertising posts, adverts will specifically target women and people with disabilities. The department seeks to improve equity in terms of women in management and takes this account in recruitment and appointment. Disaggregated data must be made available and accessible for data users. 42
AGSA FINDINGS ON DRAFT APP Indicator 3.1.1 Percentage of School Governing Bodies (SGBs) that meet the minimum criteria in terms of effectiveness. 3.1.2 Percentage of schools producing the minimum set of management documents at a required standard. DBE Response The DBE predetermine the number of schools to be sampled per province using quotas as per the formula below: Number of Schools/Province X 1 000 Total Number Nationally TID: Method of calculation. The target is specifically making specific reference to 1 000 schools. How is this 1 000 schools determined and sampled? Is there a pre-approved list of the 1 000 schools that will be sampled? Don t see this in the TID. What we ve noticed in the past is that much more than the 1 000 is sampled which also has an impact on the reporting and actual reported achievement. 4.3.2 Percentage of school principals rating the support services of districts as being satisfactory The actual 1 000 schools are pre-determined through random sampling using a formula supplied by Internal Audit. The formula is: =RAND ()inserted on each school EMIS numbers fields and the sampled number to be surveyed was selected with the application of the quota per province. Schools principals are identified to participate in the survey through a probability proportional to size (PPS) sampling method. TID: Source of data Information is obtained through a Google or Excel survey form How are the school principals identified? How is satisfactory measured? A total of 1 080 schools is drawn from the Master List of public ordinary primary and secondary schools spread equally across each of the nine (9) provinces. The sample excludes independent and special schools. Satisfactory percentage is defined as the sum of the recorded scores for 3 (Useful) and 4 (Very useful) on the Likert scale divided by the sum total of satisfied (i.e.3 and 4) + the recorded scores for not satisfied (i.e. 1 and 2) multiplied by 100. Count the number of participants reached through social cohesion programmes, delivered physically and on digital platforms, including the statistical analysis of numbers reached through radio, television and social media. 5.1.4 Number of learners, educators, parents, SGBs and other educations stakeholders reached through social cohesion programmes. TID: Method of Calculation (MOC) is inconsistent with Indicator title. 43
MTSF AREAS TO BE STRENGTHENED IN PROVINCIAL AND NATIONAL APPs Introduce a better accountability system for principals, which should be fair, based on appropriate data, and take into account the socio-economic context of schools. Some provinces have started the political and technical work around looking at accounting for performance in terms of learning outcomes and organisational effectiveness to support this at school level. Promote a comprehensive package of effective Teacher development, such as Professional Learning Communities (PLCs) and technology-enhanced in-service training. Teacher development packages and spend disaggregated by phase, subject and district will have to also include some reflection on impact. The plans for the functions of the NICPD need to be clearly articulated in terms of progress. The Sector has 20 Standard Output Indicators (SOIs) approved for 2022/23 that aim to ensure Alignment, Uniformity, Accountability, Comparability and benchmarking and Track progress for the sector priorities. The SOI s will be increased to sufficiently cover other areas of the MTSF such as Strengthened Numeracy, Reading and ECD indicators which are linked to outcomes in the 2023/24 financial year. 44
FEEDBACK FROM CABINET ON THE DBE MTSF REPORT DBE RESPONSE CABINET RECOMMENDATION Since 2021, the DBE started working alongside the DSD on the Second Children s Amendment Bill that relates specifically to the ECD sections in the Children s Act. 1. The DBE ECD unitto work with Health, Cogta, DSD, DLRD, Treasury, and GCIS to develop a new vision aligned with the National Integrated Policy for Early Childhood Development including funding This process will provide an interim solution to streamlining the ECD sections in the Children s Act to consolidating them into one chapter. In preparing for legislating the long term vision of a holistic integrated ECD Act, the DBE in partnership with UNICEF, is in the process reviewing all legislation, regulations and policies relating to ECD with the purpose of proposing draft legislation that will embed ECD as part of the basic education system, while ensuring that it clarifies the roles and responsibilities of different role players . During the 2022/23 financial year, the DBE will establish a technical task team to review the National Integrated ECD Policy to ensure that it adequately reflects the ECD function shift a) The DBE Infrastructure Branch has established contacts with DPWI responsible units. A consultative process has been initiated, DBE is awaiting confirmation of availability. b) However consultation with DPWI will be informed by the decisions of a meeting between DBE Ministry and the Presidency which is yet to be scheduled. 2. DBE and Department of Public Works and Infrastructure (DPWI) to engage on infrastructure development planning and maintenance. 45
FEEDBACK FROM CABINET ON THE DBE MTSF REPORT DBE RESPONSE CABINET RECOMMENDATION The DBE will work with National Treasury to put together a costed proposal. The proposal will be submitted by July 2022, where in the possible date for the report could be September 2022 3. DBE to work with DHET and other organisations to determine the quantum of teachers and funding needed to meet its mandate. The Cabinet has approved the roll-out of SA Connect on the 28 January 2022. The DCDT has proposed a meeting with the Director-General of the DBE to present the implementation plan of the SA Connect initiative. It should be noted that a total of 18 520 schools will be connected as part of the Universal Services Obligations (Government Gazette No 45628). 4. DBE and Department of Communications and Digital Technologies (DCDT) to develop a plan for connecting all schools,device provisioning and monitoring of the same including the role of private sector. 5. DBE, DHET and relevant Government departments to ensure agreements in the zero rating of educational websites. The sector has developed a concept paper and an opportunity to conceptualise, develop and implement a National Mathematics Improvement Plan (NMIP) on the back of the deliberations and recommendations arising from the Mathematics Indaba of 12-14 December 2016. The National plan process will include evaluation of Phase 1 Grade 1-3 TMU pilot; Phase 2 Grade 4-7; and Phase 3 Grade 8-12. 6. DBE working with DPME should evaluate current reading and numeracy programmes that hold promise Early grade numeracy Research network has been established. DBE has led several impact evaluations on what works to improve early grade reading outcomes. The first evaluation measured the impact of a Reading Catch Up Programme aimed at boosting the English proficiency of children entering Grade 4 and having to transition to English as the language of learning and teaching. The EGRS 1 project evaluated the impact of three alternative programmes all aimed at improving home language literacy and reading outcomes. EGRS 2 compared the impact of on-site coaching to a virtual coaching programme. The DBE is currently running a further evaluation project in the North West Province in which Departmental Heads of the Foundation Phase are being trained to play the role of an internal coach within the school. The DBE through the National Institute for Curriculum and Professional Development NICPD Chief Directorate, will consult with DPME in order to put together the proposal for the study. The proposal will be submitted by July 2022 with a reports envisaged by September 2022. 7. DBE needs to commission a cost effectiveness study working with DPME to understand which teacher development programs are cost effective in increasing learning 46
STRATEGIC PLAN 2020/21-2024/25 IMPACT STATEMENT, OUTCOMES AND INDICATORS Provide quality basic education for all, and lead the establishment and development of a South African schooling system for the 21st century. Outcome 1: Improved system of policies, including the curriculum and assessment, governing the basic education sector to advance a quality and inclusive, safe and healthy basic education system Outcome Indicator Baseline 1.1 Improve the proportion of 6- year-olds (Grade R) enrolled in educational institutions by 2024 1.2 Improve the proportion of 5- year-olds (Grade RR) enrolled in educational institutions by 2024 1.3 Improve the proportion of Grade R learners that are school ready by 2024 determine the baseline by 2021 Five-Year Target 96% respectively (2017) 99% 85.4% (2018) Enrolment rates of 5 and 6- year-olds at 95% by 2024 New: System for monitoring quality will be implemented to 15% increase off the baseline that will be established in 2021 47
STRATEGIC PLAN 2020/21-2024/25 IMPACT STATEMENT, OUTCOMES AND INDICATORS Provide quality basic education for all, and lead the establishment and development of a South African schooling system for the 21st century. Outcome 1: Improved system of policies, including the curriculum and assessment, governing the basic education sector to advance a quality and inclusive, safe and healthy basic education system Outcome Indicator 1.4 Increase the number of youths obtaining Bachelor-level passes in the NSC by 2024 Baseline Bachelor-level passes in NSC: 172 043 (33.6%) in 2018 Five-Year Target Bachelor-level passes: 190 000 by 2024 1.5 Increase the number of youths obtaining 60% and above in Mathematics by 2024 Youths passing Mathematics at 60% and above: 28 151 (12%) in 2018 Youths passing Mathematics at 60% and above: 35 000 1.6 Increase the number of youths obtaining 60% and above in Physical Science by 2024 Youths passing Physical Science at 60% and above: 30 368 (17.6%) in 2018 Youths passing Physical Science at 60% and above: 35 000 48
THE DBE STRATEGIC PLAN 2020/21- 2024/25 49
STRATEGIC PLAN 2020/21-2024/25 IMPACT STATEMENT, OUTCOMES AND INDICATORS Provide quality basic education for all, and lead the establishment and development of a South African schooling system for the 21st century. Outcome 2: Improved information and other systems which enable transformation and an efficient and accountable sector Outcome Indicator Baseline Five-Year Target 2.1 Improve learning outcomes in Grade 6 in critical subjects reflected through the new Systemic Evaluation by 2024 New Grade 6 performance in the new Systemic Evaluation: Mathematics Literacy: (targets to be determined after first assessment) 2.2 Improve learning outcomes in Grade 9 in critical subjects reflected through the new Systemic Evaluation by 2024 New Grade 9 performance in the new Systemic Evaluation - Mathematics: (targets to be determined after first assessment) 2.3 Improve learning outcomes in Grade 6 Mathematics according to the international SEACMEQ by 2020 Average score for Grade 6 in the SEACMEQ: Mathematics: 552 (2013) Average score for Grade 6 (SEACMEQ) for: Mathematics: 600 by 2022 50
