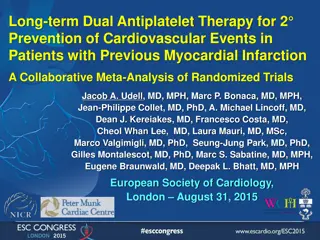
Comparing Efficacy of LPV/r QD vs. BID in Combination Therapy
Study M02-418 compared once-daily (QD) and twice-daily (BID) LPV/r in combination with TDF and FTC for HIV treatment. The primary endpoint was achieving HIV RNA

Download Presentation

Please find below an Image/Link to download the presentation.
The content on the website is provided AS IS for your information and personal use only. It may not be sold, licensed, or shared on other websites without obtaining consent from the author. Download presentation by click this link. If you encounter any issues during the download, it is possible that the publisher has removed the file from their server.
E N D
Presentation Transcript
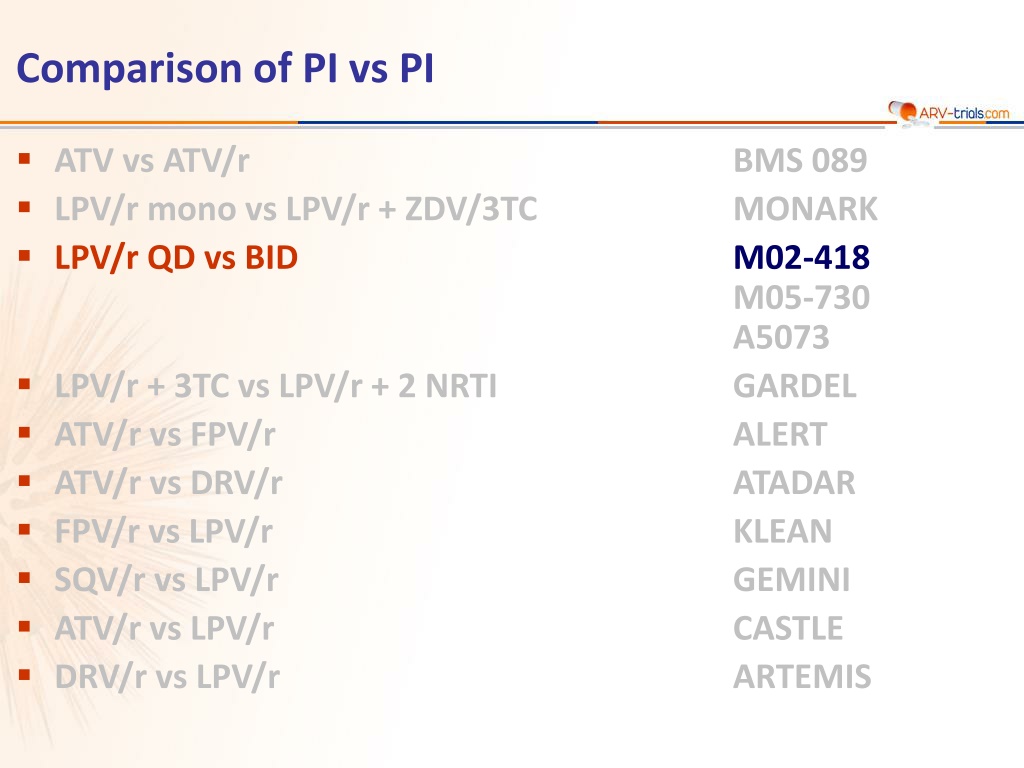
Comparison of PI vs PI ATV vs ATV/r LPV/r mono vs LPV/r + ZDV/3TC LPV/r QD vs BID BMS 089 MONARK M02-418 M05-730 A5073 GARDEL ALERT ATADAR KLEAN GEMINI CASTLE ARTEMIS LPV/r + 3TC vs LPV/r + 2 NRTI ATV/r vs FPV/r ATV/r vs DRV/r FPV/r vs LPV/r SQV/r vs LPV/r ATV/r vs LPV/r DRV/r vs LPV/r
Study M02-418: LPV/r QD vs BID, in combination with TDF + FTC Design Randomisation 3:2 Open-label N = 115 LPV/r 800/200 mg QD + TDF 300 mg + FTC 200 mg QD Adults > 18 years ARV-na ve or < 7 days prior ART HIV RNA > 1,000 c/mL Any CD4 cell count N = 75 LPV/r 400/100 mg BID + TDF 300 mg + FTC 200 mg QD Objective Primary endpoint: HIV RNA < 50 c/mL at W48 (ITT, NC = F) Non-inferiority of LPV/r QD vs BID if lower margin of the 95% CI for the difference = - 15% (> 60% power) Johnson MA. JAIDS 2006;43:153-60 M02-418
Study M02-418: LPV/r QD vs BID, in combination with TDF + FTC Patient disposition and baseline characteristics LPV/r QD 118 LPV/r BID 78 Randomized, N Treated eligible patients, N 115 75 Mean age, years 39.2 + 11.1 37.7 + 9 Female 19% 25% White/Black/Other 57% / 27% / 16% 51% / 36% / 13% HIV RNA (log10c/mL), median HIV RNA > 100,000 c/mL 4.8 4.6 44% 29% (p = 0.047 vs QD) CD4 cell count (/mm3), median 214 232 CD4 < 200/mm3 44% 47% HBsAg+ and/or HCV Ab+ 17% 20% Discontinuation before W48, n (%) 23 (20%) 22 (29%) For adverse event 14 6 For virologic failure 0 2 Note: LPV/r was administered as soft-gel capsules Johnson MA. JAIDS 2006;43:153-60 M02-418
Study M02-418: LPV/r QD vs BID, in combination with TDF + FTC Response to treatment at week 48 Primary efficacy endpoint QD (N = 115) BID (N = 75) p = 0.67 % 100 /mm3 200 196 185 80 160 71 70 65 64 60 120 40 80 20 40 0 0 ITT, NC = F TLOVR Mean CD4 increase 95% CI 95% CI for the difference = - 7; 20 for the difference = - 8; 20 Johnson MA. JAIDS 2006;43:153-60 M02-418
Study M02-418: LPV/r QD vs BID, in combination with TDF + FTC Pharmacokinetics and resistance W4 steady-stade LPV PK Genotyping and phenotyping were performed in all specimens with HIV RNA > 500 c/mL from W12 through W48 BID group (N = 24) vs QD (N = 13) Cmaxand AUC24not significantly different Significantly lower Ctroughand Cmin for QD group (p < 0.003) Median Ctrough: 4.37 g/mL for QD vs 6.64 g/mL for BID Median IQ (Ctrough/IC50*) significantly lower for QD group (48.1) vs BID (86.5; p < 0.001) LPV/r QD LPV/r BID Met criteria for resistance testing N = 11 N = 11 * Testing failure ** N = 3 N = 3 Emergence of resistance to LPV/r *** 0 0 TDF 0 0 FTC 2 1 * No specimen in 1 ** Median HIV RNA = 625 c/mL *** Any primary or active site mutation in protease at codons 8, 30, 32, 46, 47, 48, 50, 82, 84, 90, with decrease in phenotypic susceptibility to LPV > 2.5 fold *Protein-binding adjusted IC50 for wild-type HIV-1 = 0.07 mg/mL Johnson MA. JAIDS 2006;43:153-60 M02-418
Study M02-418: LPV/r QD vs BID, in combination with TDF + FTC Safety and adverse events LPV/r QD (N = 115) LPV/r BID (N = 75) p Adverse events of at least moderate severity related to study drugs * Diarrhoea Nausea Vomiting Grade 3-4 laboratory abnormalities * AST > 5 x ULN ALT > 5 x ULN Triglycerides > 750 mg/dL Amylase > 2 x ULN 18 (16%) 10 (9%) 4 (3%) N = 111 5 (5%) 4 (4%) 5 (5%) 8 (7%) 4 (5%) 6 (8%) 3 (4%) N = 74 2 (3%) 2 (3%) 3 (4%) 4 (5%) 0.036 NS NS NS NS NS NS * Occurring in > 3% of patients Discontinuation for gastro-intestinal adverse events: QD (N = 9) vs BID (N = 2) 1 death in BID group, unrelated to study drugs (adenocarcinoma) W48 increase: LDL-cholesterol + 14 mg/dL in both groups; HDL-cholesterol: QD + 3 mg/dL vs BID + 6 mg/dL LDL-cholesterol > 130 mg/dL: 14% at baseline vs 26% at W48 (2 groups combined) HDL-cholesterol < 40 mg/dL: 58% at baseline vs 42% at W48 (2 groups combined) GFR (MDRD [mL/min/1.73 m2)]: 112 at baseline, 104 at W48 (2 groups combined), p < 0.001, with no differences between groups. 1 case of acute renal failure in each group. Johnson MA. JAIDS 2006;43:153-60 M02-418
Study M02-418: LPV/r QD vs BID, in combination with TDF + FTC Summary - Conclusion In previously untreated HIV-1 infected adults, LPV/r soft-gel capsule 800/200 mg QD was non inferior to LPV/r 400/100 mg BID, in combination with TDF + FTC QD Virologic response rate at W48 (HIV RNA < 50 c/mL) was 70% in the QD group and 64% in the BID group Immunologic recovery was similar in the 2 treatment arms There were greater number of discontinuations for adverse events (primarily gastrointestinal) and a significantly higher rate of diarrhoea in the QD group No significant differences in lipid changes was seen between the 2 groups Most pronounced lipid effect was triglyceride elevation Lipid increases were less than observed with LPV/r + thymidine analogues Lack of LPV resistance emergence in either group Lower Ctrough with LPV/r QD, not associated with reduced virologic response Limitation of the study: only 60% power to determine non inferiority of LPV/r QD Johnson MA. JAIDS 2006;43:153-60 M02-418