Enhancing Healthcare Efficiency Through Lean Six Sigma Principles
Explore the impact of external forces on the healthcare environment and learn about Lean Six Sigma methodologies. Discover how Lean and Six Sigma aim to reduce waste, improve quality, and enhance patient satisfaction by focusing on process efficiency and effectiveness. Dive into the eight forms of waste in healthcare and understand how applying Lean Six Sigma principles can lead to higher quality care, better safety records, increased patient satisfaction, and cost savings.

Download Presentation

Please find below an Image/Link to download the presentation.
The content on the website is provided AS IS for your information and personal use only. It may not be sold, licensed, or shared on other websites without obtaining consent from the author. Download presentation by click this link. If you encounter any issues during the download, it is possible that the publisher has removed the file from their server.
E N D
Presentation Transcript
Presented by: Kristen Roig, MA, RHIA, LSSBB
External Forces Impacting the Healthcare Environment Population Health Quality Based Reimbursem ent Regulatory Healthcare Facilities Patient Safety ICD 10
What is Lean? A systematic approach of analyzing the flow of information, processes, and materials in order to eliminate waste while striving for continuous improvement to achieve enhanced value to the customer. The elimination of waste and wasteful processes
What is Six Sigma? Six Sigma seeks to improve the quality and reliability of process outputs by identifying and removing the causes of errors (defects) and minimizing variability in processes. The elimination of defects and variability within processes
Lean vs. Six Sigma Lean Six Sigma Remove waste Increase process speed Eliminate non-value added steps and time in process Fix connections between steps Improve process efficiency Reduce variation Improve quality and accuracy Optimize remaining process steps Improve process effectiveness Focused on the customer
Lean & Six Sigma Lean Six Sigma Higher quality Better safety record Improved care Increased patient satisfaction Faster & more efficient processes Lower costs Six Sigma Lean Waste Speed Defects Accuracy
Eight Forms of Waste Timwoods 1 2 3 4 Transport Inventory Motion Wait Examples: Examples: Examples: Examples: Moving patient from one unit to another An admitted patient is stored in ED waiting for bed on unit (ED boarder) Nurse moving all over unit to gather supplies Patient waiting for assessment Transferring supplies from one room to another Outdated forms are stored on inpatient units. Provider moving up and down floors to see patients Clinicians waiting for supplies Moving patient for labs/tests then back to room Stocked materials that are expired Clinician moving back and forth to printer multiple times per day Waiting for a paper to print Moving paper records from one desk to another Brochures of information is that out of date Waiting for a screen to load
Eight Forms of Waste Timwoods 5 6 7 8 Defects/ Rework Over Over/Under Processing Staff s Unused Potential Production Examples: Examples: Examples: Examples: Prepping for procedure not yet scheduled Excessive telemetry alarms No insurance authorization for service Problem solving ideas ignored Meds prepped early Too many CT scans that we unnecessary Incomplete medical record documentation Time spent on non-value added actions Multiple forms all asking the same thing Too few flu vaccinations provided Providing wrong treatment Identified problem not fixed Batching materials at the start of the day Repetition of diagnostic tests Wrong diagnosis made Improvements not supported
Applying Lean Tools in HIM Issue: Susan is an HIM clerk who is responsible for answering the department s main phone line, greeting internal and external customers and other clerical functions. Susan s daily workflow took her from her desk , to the copier, to the fax, file cabinet, and back several times per day which resulted in phones being unanswered or co- workers being interrupted. Type of waste Motion.
Lean Tool- Spaghetti Diagram of Current State Distance travelled in steps: Time taken per trip: Total time spent each day: 171 steps per trip x 6 trips per day 85 seconds travel ; 5 minutes task time 38.5 minutes/day .
Lean Tool: Spaghetti Diagram of Future State (moved desk and her files; added a scanner) Distance travelled in steps: Time taken per trip: Total time spent each day: A savings of 10.5 minutes 75 steps per trip x 6 trips per day 40 seconds travel ; 4 minutes task time 28 minutes/day
Applying DMAIC Methodology Control Define D C Measure Improve Problem M I A Analyze
Define Measure Analyze Improve Control Gather information on nature and extent of problem Identify and measure potential causal factors Study the data to determine root cause(s) Pilot interventions and assess improvement Create Control Plan and follow-up SIX SIGMA HEALTHCARE Implement treatment and assess patient improvement Prescribe treatment plan and follow-up Study findings and diagnose Obtain patient history and symptoms Perform physical and diagnostics (blood work, x-ray, etc.)
Key Elements of Define Gather baseline information 1. Define the problem (Problem Statement) 2. Validate the problem with Data Align on goal (Goal Statement) 3. Identify the customer(s) 4. Collect Voice of the Customer 5. Translate customer feedback into key issues (What is 6. critical to quality for the customer?)
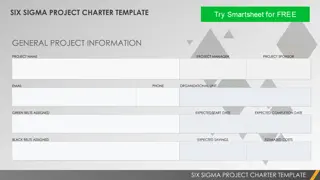
Example: Defining the Problem Problem Statement: FY'13 data for Advance Beneficiary Notice (ABN) and Local Medical Review Policy (LMRP) denials resulted in $531K, which is an increase of $91k (21%) from FY'12 denials. Denials negatively impact the financial viability of the organization. Goals/Objective(s): Reduce denials from $44,515 per month to $35,167/month (a 21% reduction), by January, 2014.
Validation of Problem- Always validate with data FY 13 financial data shows denials of outpatient laboratory tests due to lack of medical necessity averaging $44,515/month. Project Report Template 16 .PPT
List and prioritize (Rank) Customers on a scale of 1, 5, 10 with 1 being most important and 10 being the least important regarding impact on the project goal(s) Voice Of Customer Strategy/Plan Voice of the Customer (VOC) Matrix Rank 1 Voice of Customer Key Issue CTQ (the Y) Customer "I want my test performed without delays" Efficiency 100% of scripts must be present, complete and compliant 100% of scripts must be present, complete and compliant 100% of scripts must be present, complete and compliant 100% of claims contain appropriate codes Education on what's being denied and why Patient "I want my test covered" Medical Necessity Correct Diagnosis Medical necessity 10 "I want to receive a clean claim/bill from the treating entity" Payer Correct Diagnosis 5 "I want the appropriate test performed, and I want to understand the appropriate diagnoses to support the test" "I want patients to have an ideal healthcare experience and want clean data to support payment for services provided" Education / Knowledge Physician 10 Efficiency All of the above Administration 5 "We want accurate documentation to use for coding, and want sufficient time to review each outpatient account" Correct Diagnosis 100% of diagnoses and scripts to support the test" Coding dept. Project Report Template 17 .PPT
Key Elements of Measure 1. Develop list of questions to answer 2. Collect data to answer questions 3. Present data visually 4. Map the process 5. Determine what in the process is value added vs. what is non-value added What is the customer willing to pay for?
Measuring the Problem Question 1: What is the breakdown of denials by Service? Vital Few Useful Many Project Report Template 19 .PPT
Measure the Problem Question 1: What is the breakdown of denials by Service Vital Few Useful Many
Gemba Walk Walk the Process Project Report Template 22 .PPT
Key Elements of Analyze Study the data 1. Brainstorm potential root causes 2. A dynamic group exercise in which participants generate ideas and opinions on a given subject in an organized way Limit to a 30-45-minute activity max Group in the Fishbone Diagram 3. Uncover the deep causes with 5-Why 4. Prove or disprove potential root causes with data Determine the true, proven root causes (known as the vital few root causes) 5. 6.
Analyzing the Problem-Cause-Effect Diagram(s)- Legend: Red text potential root cause Circled red text - See 5 Why analysis Project Report Template 24 .PPT
5 Why Analysis PROCESS ABN Process not consistently being followed in Outpatient Registration Why? ABN Checker screens not accessible via all Registration Pathways Why? ABN checker/pathway is not always included in the profile when new services established in SMS Why? New Service Project Plan tool does not have a line item Potential Root Cause Project Report Template 25 .PPT
5 Why Analysis PROCESS/ MATERIALS Nursing Home SNA accounts denied by Medicare Why? The financial class of M is being linked to the account Why? Patient has multiple forms of Insurance and each of these need to be sequenced appropriately in SMS to avoid denial Why? There is a limitation is SMS system logic Potential Root Cause Project Report Template 26 .PPT
Key Elements of Improve 1. Brainstorm potential solutions 2. Evaluate and prioritize solutions 3. Develop implementation plan 4. Pilot solutions 5. Interpret results and adjust solutions accordingly
Develop Solutions Proven Cause Solution ABN Checker is not included in all necessary Registration Pathways Revision to New Service Project Plan tool to include a line item assessing the need to add the Checker SMS Insurance Sequencing issue for Nursing Home (SNA) accounts Enhance SMS system to allow for more than 3 insurance entries Educate Registrar on importance of proper sequencing Educate Registrar to made all changes when account is in OT Status Over-utilization of PT/INR and EKGs in the ED Modify order set to avoid accidental ordering of these tests Educate ED docs Coders are performing chief complaint coding versus coding from source documents Implement process to code only from source documents (scanned lab scripts, EMR)
Key Elements of Control 1. Develop Control Plan 2. Implement mistake-proofing techniques 3. Incorporate visual aids 4. Create or update standards or procedures 5. Define new standard work expectations
Why is Control Important? Most important phase of DMAIC The difference between Lean Six Sigma and other flavor of the month fixes Maintain the gains Has anyone seen improvements return to their original state after a few months? Improved Results Original State
In Summary Healthcare Facilities are seeking ways to create efficiencies within processes and avoid non-value added activities. Lean/Six Sigma methodology is a proven method designed to assist in eliminating waste and decreasing defects. Change happens one project at a time.


-")