Mining Readiness Strategy for Thunder Bay and Northwestern Ontario
A comprehensive Mining Readiness Strategy prepared by MNP LLP for the City of Thunder Bay and the CEDC focusing on business development, supply and services, workforce training, infrastructure, economic impact, research and development, and identifying gaps and barriers in exploration and mine development in Northwestern Ontario. The report provides strategic recommendations to support the exploration and mining sector in the region.

Download Presentation

Please find below an Image/Link to download the presentation.
The content on the website is provided AS IS for your information and personal use only. It may not be sold, licensed, or shared on other websites without obtaining consent from the author. Download presentation by click this link. If you encounter any issues during the download, it is possible that the publisher has removed the file from their server.
E N D
Presentation Transcript
FINAL DRAFT Mining Readiness Strategy Prepared by MNP LLP for the City of Thunder Bay and the Community Economic Development Commission (CEDC) February 11, 2021 Ambassadors Northwest Suite 701, 34 Cumberland St. N. Thunder Bay, ON P7A 4L6 gotothunderbay.ca
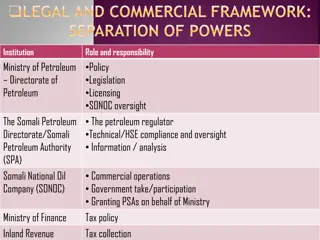
Introduction A guiding framework for the City of Thunder Bay to support the growing Northwestern Ontario mining sector The City of Thunder Bay and the Community Economic Development Commission (CEDC) engaged MNP and TBT Engineering to develop a Mining Readiness Strategy focused on regional developments over the next ten years (2020 to 2030). The report focuses primarily on: Business Business Development Development in in Supply including connecting directly with the 6 mines and 15 exploration managers, identifying indirect and induced businesses and gaps in the supply chain. Supply and and Services Services: : Maximizing exploration and mining service and supply opportunities for Thunder Bay, Workforce Workforce Training college, university and trade programs and how to address any gaps. Training and and Development Development: Develop an understanding of positions required by mines now and in the future, assess existing Transportation Transportation and Electrical 15 exploration sites. and Electrical Infrastructure Infrastructure: Identify road, port and airport access and electricity requirements and constraints for the Economic Economic Impact the 6 producing mines and 15 exploration projects. Impact of of New New and and Existing Existing Mine Mine Developments Developments for Thunder Bay for Thunder Bay: Estimate the contribution to Thunder Bay s economyby Research Research and and Development: Development: Identify potential technology advances and partnerships with local education and research centers. Identifying Identifying Gaps Gaps and and Barriers Barriers to to Exploration Exploration and and Mine Mine Development Development in in Northwestern Northwestern Ontario. Ontario. The report concludes with strategic recommendations that the CEDC can implement to support the exploration and mining sector in the City of Thunder Bay and Northwestern Ontario. 2
Regional Mining Overview Ontario Currently the largest producer in Canada of gold, platinum group metals, and nickel. Second largest producer of copper. The value of mineral production in Ontario has consistently exceeded $10 billion since 2014, and reacheda value of $10.7 billion in 2019. Exploration expenditures between $517 to $585 million over the last three years. Estimated 26,000 direct jobs and 46,000 indirect jobs in mineral processing and mining supplyand services in Ontario. In 2020, Ontario had 40 operating mine sites (20-gold mines, 9-base metal mines 1-iron mine and 1- platinum group metalmine). 4
Regional Mining Overview Northwestern Ontario Distribution of Metals by Major Exploration Sites and Active Mines Total Count 6 15 6 Existing Operating Mines Primarily gold mines, and one palladium mine. Nickel-Copper-PGE 1 Graphite 1 15 Major Exploration Sites Primarily gold, palladium andlithium. Lithium 3 Palladium 1 3 Gold 5 7 0 5 10 15 20 25 Quantity of Operating Mine Sites Quantity of Major Exploration Sites 5
Regional Mining Overview Northwestern Ontario Historic Active Operating Mine Production (Gold and Palladium) 1,200,000 208,000 1,000,000 242,000 Ounces of Gold and Palladium 790,000+ Average Ounces of Gold Produced per Year 45,000 158,000 800,000 208,000 227,000 227,000 257,000 261,000 37,000 27,000 600,000 140,000 205,000 236,000 257,000 3,000 Between 5 current gold mines. 200,000+ 235,000 400,000 207,000 171,000 196,000 213,000 200,000 324,000 277,000 276,000 209,000 Average Ounces of Palladium Produced per Year 150,000 0 2016 Red Lake Mine (Gold) Musselwhite Mine (Gold) Sugar Zone Mine (Gold) 2017 2018 2019 2020* By 1 current palladium mine. Hemlo Mine (Gold) Rainy River Mine (Gold) Lac des Iles Mine (Palladium) *2020 production value is estimated. 6
Mining Industry Stakeholder Feedback Top Interview Themes The CEDC is perceived by mining industry stakeholders as a key facilitator forbusiness introductions and sharing knowledge about economic development opportunities and support. 1 City/CEDC needs to advance their marketing and communications strategy to emphasize that Thunder Bay is a full-service hub for Northwestern Ontario. 2 Exploration and mining companies will prefer to buy local if their supply chain staff are aware of the local businesses which are qualified to deliver the needed supplies and services. 3 There is an emerging opportunity for critical mineral processing and support directly within the municipal boundaries of Thunder Bay. 4 There is a near-term great need for skilled trades and numerous types of support services roles as new mines are constructed and begin operations. 5 8
Mining Industry Stakeholder Feedback Top Interview Themes A tailored strategy to support local workers and Indigenous community members gain the job skills along with the logistical support to get to the work sites isneeded. 6 The city of Thunder Bay has abundant municipal infrastructure to support growth in the regional mining industry, but the broader northwest regional infrastructure has some significant challenges with road and electricitysupply. 7 Thunder Bay is currently receiving significant economic benefits due to the mining industry and is well perceived and positioned to benefit from the forecasted increase in miningactivity. 8 All mining companies are willing to partner with local research facilities if the opportunity arises. 9 Extended timelines for permitting and approvals is seen as the major impedimentto advancing mine development. 10 9
Mining Supply and Services Business Development in Thunder Bay Business Type Focus Areas Workforce Training Skilled trades training centers. Mining skills training centers. Life skills and career development services. Available Land Promote available commercial and industrial land available in the city. Proximity to Mines Local distribution centers. Transportation and logistics services (e.g. trucking). Equipment and parts service centers. General mine support services (e.g. security, transportation, cleaning, catering, health, etc.). Ground support materials Critical Minerals Chemical processing plants for critical mineral processing (e.g. lithium, graphene). (e.g. shotcrete). 1 0
Workforce Training and Development Northwestern Ontario Estimated 20-Year Employment Projection 100% Increase in Mine Operations Jobs Estimated to peak at 7,400+ total positions. 3,600+ MineOperations Jobs in 2020 Estimated for the 6 operating mines in Northwestern Ontario. 8,000 7,000 6,000 5,000 No. of Jobs 4,000 7,000+ Peak Mining Jobs between 2023-2028 Estimated jobs required for construction and operation of new and existing mines. 2,000+ Peak Construction Jobs in 2023 Estimated for the 15 major explorationsites in Northwestern Ontario. 3,000 2,000 1,000 0 No. of Existing Operations Jobs No. of New Operations Jobs 10
Workforce Training and Development Northwestern Ontario Estimated Mining Occupation Distribution (Current and Peak Levels) Human Resources and Financial Occupations 237 Support Workers 325 239 2X Operations Job Growth Estimated around 2026 when all six current operating mines are still in production and multiple major exploration sites have converted to operating mine sites. Technical Occupations 245484 248 Supervisors, Coordinators, and Foremen 255 503 311 319 Professional and Physical Science Occupations 630 402 Trades Occupations 413 815 881 Production Occupations 904 1,785 1,295 Other Occupations 1,329 2,625 3,000 0 1,000 No. of Operations Jobs 2,000 No. of Current Operations Jobs (2020) No. of New Operations Jobs (2026, 2027) No. of Peak Operations Jobs (2026, 2027) 12
Transportation and Electrical Infrastructure Access Road Requirements Of the 15 exploration sites reviewed, 60 percent had minimal or moderate access road construction requirements, due mostly to their advantageous location close to the major highway network in Northwestern Ontario. Sites requiring major construction include: N/A 13% Major 27% Minimal 20% Access to the Ring of Fire. Realigning existing Highway 11 road and electricity infrastructure that is currently passing through the site. Moderate 40% Construction of all-season roads to improve current access restrictions of air travel and winter road only access (Frontier Lithium s PAK project, and First Mining Gold s Springpole Lake project). 13
Transportation and Electrical Infrastructure Electricity Supply Requirements Of the 15 exploration sites reviewed, 53 percent had minimal or moderate electricity infrastructure requirements, due to their proximity to nearby transmission lines. Sites requiring major electricity infrastructure constructioninclude: N/A 13% Major 34% Minimal 13% Multiple sites requiring over 25 km of new transmission lines. Multiple sites requiring power plants to be built due to lack of available local transmission lines or capacity. Moderate 40% 14
Transportation and Electrical Infrastructure Electricity Demand Projection Northwestern Ontario Total Impacts 600 190 MW Estimated Current Operating Mine Electricity Demand Levels expected to be maintained until 2027. 500 Peak Power Demand (MW) 400 300 180% Estimated increase in Electricity Demand from New Mines in 2026 Levels expected to increase from 190 MW present day amount to over 540 MW. 200 100 0 Total Existing Demand of 6 Mines Total New Demand of 15 Exploration Sites 15
Transportation and Electrical Infrastructure Electricity Demand Projection Regional Impacts 380% Estimated Electricity Demand Growth in Marathon-Greenstone 160 140 Peak Electricity Demand (MW) From 3 new major exploration sites. 220% 120 100 116 60 80 84 Estimated ElectricityDemand Growth in Red Lake 40 60 From 4 new major exploration sites. 80-150% Estimated Electricity Demand Growth in Fort Frances, Thunder Bay and Northern Regions 40 30 57 50 20 37 30 20 12 10 0 Marathon- Red Lake Greenstone Fort Frances Thunder Bay Northern Dryden Kenora Future Regional Peak Demand Required by Exploration Sites Current Regional Peak Demand of Operating Mines From 6 new major exploration sites. 16
Economic Impact Projected Mining Output for Current Operating Mines and Major Exploration Projects Current Operating Mines Major Exploration 1,400,000 1,400,000 1,200,000 1,200,000 1,000,000 1,000,000 Ounces/Tonnes 800,000 800,000 Production (Ounces) 600,000 600,000 400,000 400,000 200,000 200,000 0 0 Palladium Production (Oz) - Projected Gold Production (Oz) - Projected Total Production - Precious Metals (Ounces) Total Production - Other (Tonnes) 17
Economic Impact Estimated Total Direct, Indirect and Induced Output for Northwestern Ontario Economic Output is the total gross value of goods and services produced by a given organization, industry or project, measured by the price paid to the producer. This is the broadest measure of economic activity. Direct impacts are changes that occur in front-end businesses that would initially receive expenditures and operating revenue as a direct consequence of the operations and activities of a facility. Indirect impacts arise from changes in activity for suppliers of the front-end businesses. Induced impacts arise from shifts in spending on goods and services as a consequence of changes to the payroll of the directly and indirectly affected businesses. $10,000 $8,710 $7,940 $8,000 $5,910 $6,000 $4,370 Million $4,000 $ $2,620 $2,000 $0 2019 2020 Average 2021 Average 2026 Average2029 to 2025 to 2028 to 2030 Advanced Stage Exploration Projects - Operations Advanced Stage Exploration Projects - Construction Operating Mines 18
Strategic Recommendations Main Focus Areas to be Implemented throughout 2021 1. The CEDC should act quickly to implement the strategic recommendations with completion targets by the end of 2021. 2. Leverage technology and digital media by enhancing the CEDC Mining website, allowing ease of access to contemporary information and facilitate the exchange of information and data. 3. Develop or expand on the CEDC mining readiness Marketing and Communications plan to ensure the Thunder Bay is widely known as the node for facilitation, collaboration, training and information of mining related services. 4. Advanced facilitation and knowledge transfer about the regional Mining Supply and Services offerings, making prospective clients and companies aware of who s in the region and able to support the growing mining industry. 5. Promote Thunder Bay as the Workforce Training and Development hub for mining sector and inform the education and training associations of what types of jobs are needed in the future. 6. Improve the regional mining industry stakeholders awareness (e.g. electricity planning and infrastructure organizations, exploration and mining companies, and provincial and federal government) of the Transportation and Electrical Infrastructure needs and planned or in-progress projects. 7. Evaluate strategic incentives and municipal infrastructure priorities which incentivize Business and Economic Development for the Mining Sector. 19
Strategic Recommendations Estimated Implementation Plan GANTT: Thunder Bay Mining Readiness Strategy START 2021 NO. ACTION DATE TIMELINE Q1 Q2 Q3 Q4 1.1 2.1 3.1 3.2 3.3 3.4 3.5 4.1 4.2 4.3 4.4 4.5 5.1 5.2 5.3 5.4 6.1 6.2 6.3 6.4 7.1 7.2 7.3 Implement strategic actions within next 12mths Digital media and website enhancement plan Facilitate industry introductions Provide quarterly dashboardemails Case studies of successful indigenousrelations Promote Thunder Bay as a full-service community Regular government communications on mining Promote existing mining sectorsupply/services Communicate/develop critical mineralprocessing Enhance existing mining supply/servicedirectory Mining sector supply chain info on CEDC website Available vacant land info on CEDC website Gather skills gaps and current/future job data Facilitate working groups withtrainers/educators Promote mining skills, positions andtraining Provide information on localeducation/training Gather data on site infrastructure requirements Communicate infrastructure gaps andbarriers Public updates on infrastructure initiatives Prioritize updating the InternationalAirport Strategic incentives for attracting businesses Prioritize municipal infrastructure developments Develop/expand COVID-19 economic recovery 4 2 4 1 1 4 4 4 2 3 2 1 4 3 4 2 1 1 2 4 4 2 4 1 1 1 2 3 1 1 1 2 2 2 2 1 2 1 2 3 4 3 1 1 3 1 20