Analysis of Speeding-Related Crashes and Roadway Conditions
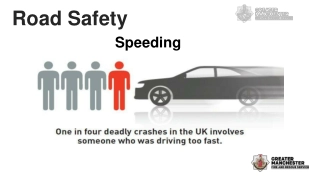
The data presented delves into the impact of speeding on road safety, highlighting alarming statistics such as the number of fatal/serious crashes related to speeding. It also analyzes different types of speed violations, notable trends in speeding behavior across demographics, and the urban speeding problem. Additionally, the data explores the correlation between speeding and various roadway conditions, emphasizing the need for targeted interventions to address this significant issue.
Download Presentation

Please find below an Image/Link to download the presentation.
The content on the website is provided AS IS for your information and personal use only. It may not be sold, licensed, or shared on other websites without obtaining consent from the author.If you encounter any issues during the download, it is possible that the publisher has removed the file from their server.
You are allowed to download the files provided on this website for personal or commercial use, subject to the condition that they are used lawfully. All files are the property of their respective owners.
The content on the website is provided AS IS for your information and personal use only. It may not be sold, licensed, or shared on other websites without obtaining consent from the author.
E N D
Presentation Transcript
Speeding Breakout Matthew Enders, P.E. Target Zero Partners Meeting WSDOT Local Programs 12/8/15
The Data O 2008 2008- -2014 (7 years) 2014 (7 years) O Exceeding Stated Speed Exceeding Stated Speed O Exceeding Reasonable Safe Speed Exceeding Reasonable Safe Speed O 151,304 total speed 151,304 total speed- -related crashes O 21% of all crashes 21% of all crashes O 4,724 fatal/serious (FS) speed 4,724 fatal/serious (FS) speed- -related crashes O 28% of all fatal/serious crashes 28% of all fatal/serious crashes related crashes related crashes
Type of Speed O Exceeding Stated Speed Exceeding Stated Speed O 1,523 (FS) and 13,913 (Total) 1,523 (FS) and 13,913 (Total) O Exceeding Reasonable Safe Speed Exceeding Reasonable Safe Speed O 3,322 (FS) and 140,515 (Total) 3,322 (FS) and 140,515 (Total) Fatal/Serious Non-Fatal/Serious Stated 8% Stated 31% Safe 69% Safe 92%
The Split Speed Fatal/Serious Misc 3% All Fatal/Serious Misc 2% City 29% State 35% State 32% City 40% County 33% County 26%
Roadway Conditions Speed Fatal/Serious Non-Speed Fatal/Serious Other 2% Ice/Snow 2% Ice/Snow 10% Other 1% Wet 21% Wet 22% Dry 76% Dry 66%
Noteworthy Data Items Horizontal Curves Horizontal Curves 46% Speeding FS vs 27% All FS Motorcycles Motorcycles 22% Speeding FS vs 13% All FS Male Male 80% Speeding FS vs 68% All FS 16 16- -30 Year 30 Year- -Olds 53% Speeding FS vs 35% All FS Olds No Restraints No Restraints 20% Speeding FS vs 14% All FS Compared to 2.7% for total crashes (speed-related and all)
The Urban Speeding Problem O Run Run- -off on high on high- -speed facilities speed facilities off- -road may imply rural, isolated locations road may imply rural, isolated locations O For state routes it is an even split For state routes it is an even split (51% urban vs 49% rural) (51% urban vs 49% rural) All Roads (FS) Rural 42% Urban 58% O For county roads the issue is more For county roads the issue is more rural (33% urban vs 67% rural) rural (33% urban vs 67% rural)
SR Locations with Speeding FS O I I- -5 = 5 = 342 Clark, 21 Thurston) Clark, 21 Thurston) 342 (137 King, 60 Pierce, 52 Snohomish, 27 (137 King, 60 Pierce, 52 Snohomish, 27 If you dig into the urban issue in greater detail, the I-5 problem focuses the most on the greater Seattle area during peak hours O I I- -90 = 117 90 = 117 (41 Spokane, 29 King, 27 Kittitas) (41 Spokane, 29 King, 27 Kittitas) O US 2 = 69 US 2 = 69 (16 Spokane, 14 Snohomish, 14 Chelan) (16 Spokane, 14 Snohomish, 14 Chelan) O US 101 = 59 US 101 = 59 (14 Jefferson, 13 Mason, 12 Clark) (14 Jefferson, 13 Mason, 12 Clark) O SR 20 = 59 SR 20 = 59 (16 Skagit, 12 Okanogan) (16 Skagit, 12 Okanogan) O SR 99 = 57 SR 99 = 57 (44 King, 10 Snohomish) (44 King, 10 Snohomish) O I I- -405 = 51 405 = 51 (41 King, 10 Snohomish) (41 King, 10 Snohomish)
Posted Speed (FS) 1117 47% at 35 MPH or less 608 581 581 346 343 306 282 152 21 18 20 MPH 25 MPH 30 MPH 35 MPH 40 MPH 45 MPH 50 MPH 55 MPH 60 MPH 65 MPH 70 MPH
Discussion Question #1 O How are drivers in low speed conditions How are drivers in low speed conditions (cities, congested freeways) getting (cities, congested freeways) getting killed/seriously injured? killed/seriously injured? O The majority of fatal/serious speeding The majority of fatal/serious speeding crashes occur on urban arterials or urban crashes occur on urban arterials or urban freeways (such as I freeways (such as I- -5 in Seattle during commute times). commute times). O Few of the fatal/serious speeding crashes Few of the fatal/serious speeding crashes involve rearend crashes (only 12%), while involve rearend crashes (only 12%), while most involve running off the road (62%). most involve running off the road (62%). 5 in Seattle during
Discussion Question #2 O How do we get drivers to drive the speed we How do we get drivers to drive the speed we want? want?
Discussion Question #3 O There are low There are low- -density speed collisions covering a vast network of roads collisions covering a vast network of roads (state and county). (state and county). O How do we address these? How do we address these? density speed- -related related
Discussion Question #4 O What role does reporting play in the What role does reporting play in the speeding problem? speeding problem? O Speeding may be easier to cite than following Speeding may be easier to cite than following too close, for prosecution too close, for prosecution O Some cities are significantly overrepresented Some cities are significantly overrepresented in speed in speed- -related crashes per population related crashes per population (compared to other cities) while others are (compared to other cities) while others are significantly underrepresented significantly underrepresented
 undefined


