Analysis of Disability Data Using U.S. National Health Interview Survey
The U.S. National Health Interview Survey (NHIS) conducts an annual cross-sectional household survey to collect data on various health aspects, including disability. The Functioning and Disability module within NHIS includes a set of questions to assess difficulties in areas such as vision, hearing, mobility, cognition, self-care, and communication. By analyzing responses to these questions, a disability continuum can be defined, allowing for the identification of persons with disabilities based on specific thresholds of functioning difficulty. This analysis aids in generating internationally comparable data on disability prevalence and its impact on various aspects of life such as education and employment.
Download Presentation

Please find below an Image/Link to download the presentation.
The content on the website is provided AS IS for your information and personal use only. It may not be sold, licensed, or shared on other websites without obtaining consent from the author. Download presentation by click this link. If you encounter any issues during the download, it is possible that the publisher has removed the file from their server.
E N D
Presentation Transcript
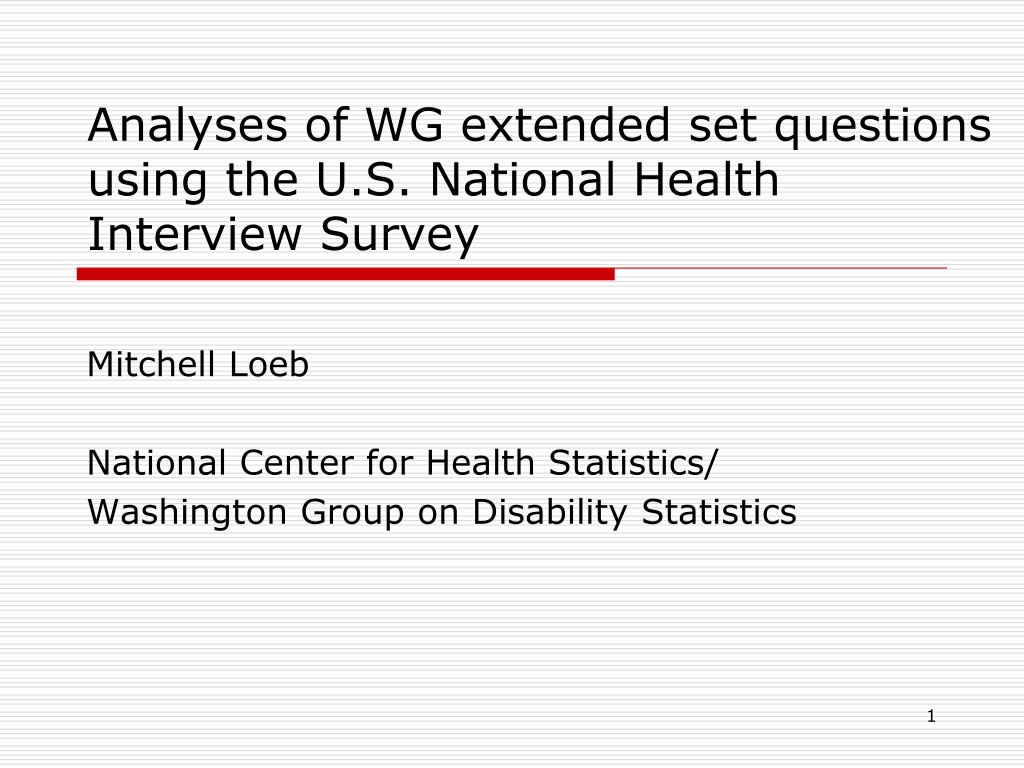
Analyses of WG extended set questions using the U.S. National Health Interview Survey Mitchell Loeb National Center for Health Statistics/ Washington Group on Disability Statistics 1
National Health Interview Survey The NHIS is a cross-sectional household survey of the civilian, non-institutionalized population of the United States, conducted annually by NCHS since 1957. Data are collected in person from a sample based on a multistage probability design. Annually, the NHIS comprises approximately 35,000 households containing about 87,500 persons per year Functioning and Disability module is part of the Sample Adult file: includes about 17,000 persons 2
WG short set of questions: Because of a Health problem: 1) Do you have difficulty seeing even if wearing glasses? 2) Do you have difficulty hearing even if using a hearing aid? 3) Do you have difficulty walking or climbing stairs? 4) Do you have difficulty remembering or concentrating? 5) Do you have difficulty with (self-care such as) washing all over or dressing? 6) Using your usual language, do you have difficulty communicating (for example understanding or being understood by others)? Response categories: No - no difficulty; Yes - some difficulty; Yes - a lot of difficulty; Cannot do at all 3
Defining a disability continuum and a disability dichotomy The WG questions fulfil two specific data needs: to describe disability data as a continuum of functioning from no difficulty to some difficulty, a lot of difficulty and unable to do at all, and to define a cut-off (or a set of cut-offs) that can be agreed upon internationally in order to disaggregate other information (e.g. access to education, employment) by disability status 4
WG Recommendation: For purposes of reporting and generating internationally comparable data, the WG has recommended the following cutoff be used to define the population of persons with disabilities: The sub-population identified as with disability includes those with at least one domain that is coded as a lot of difficulty or cannot do it at all. 5
Creating a disability dichotomy Responses to the 6 questions range from 1: no difficulty to 4: cannot do at all If responses at all 6 questions are 1 or 2 i.e. the person has no difficulty or only some difficulty over the 6 domains, then the individual is considered as without disability. If any one (or more) of the 6 domain responses is 3: a lot of difficulty or 4: cannot do at all then the person is considered as with disability. 6
Level of Severity in the population (n=16,777) (2013) Person with disability has at least: Unweighted N Weighted % 1 Domain that is at least some difficulty 2 Domains that are at least some difficulty 7,511 41.9 3,672 19.6 1 Domain that is at least a lot of difficulty 1,872 9.5 1 Domain is unable to do it 465 2.2 7
Rational for Extended Set Questions: 1) To include additional domains that were not included in the Short Set (upper body functioning, affect, pain, and fatigue) To include more information per domain (for example, use of assistive devices/aids, and functioning with and without assistance) To develop a single measure, per domain, for un-accommodated functioning To use the additional information per domain to develop a continuum of functioning that would supplement the Short Set 2) 3) 4) 8
Going from SS to Extended set What are the challenges going from a single question per domain to multiple questions per domain? 1. The need to determine the added value of multiple questions. 2. The need to be able to combine multiple indicators to form a continuum of functional difficulty. 9
Vision: Short/Extended set questions 1. Do you have difficulty seeing, even when wearing glasses? (SS) Initial analyses using proposed extended set questions (difficulty with near and far vision) did not create a continuum of functioning, so the questions were not included in the Extended set. 10
Do you have difficulty seeing, even when wearing glasses? SS (2013) Unweighted Frequency 13,690 Weighted Percent 82.9 No difficulty 2,708 15.1 Some difficulty 333 1.8 A lot of difficulty 36 0.2 Cannot do Total 16,767 100.0 11
Communication: Short/Extended set questions 1. Using your usual language, do you have difficulty communicating, for example, understanding or being understood? (SS) 12
Using your usual language, do you have difficulty communicating, for example, understanding or being understood? SS (2013) Unweighted Frequency 15,874 Weighted Percent 95.2 No difficulty 745 4.1 Some difficulty 94 0.5 A lot of difficulty 43 0.2 Cannot do Total 16,756 100.0 13
Hearing: Short/Extended set questions 1. Do you have difficulty hearing, even when using a hearing aid? (SS) 2. Do you have difficulty hearing what is said in a conversation with one other person in a quiet room [even when wearing your hearing aid(s)]? 3. Do you have difficulty hearing what is said in a conversation with one other person in a noisier room [even when wearing your hearing aid(s)]? Analyses were conducted on Q2 and Q3. 14
Do you have difficulty hearing, even when using a hearing aid? SS (2013) Unweighted Frequency 13,680 Weighted Percent 82.8 No difficulty 2,753 15.4 Some difficulty 310 1.7 A lot of difficulty 23 0.1 Cannot do Total 16,766 100.0 15
Difficulty hearing in a noisy room by quiet room (NHIS 2013) Noisy room No Some difficulty A lot of difficulty Cannot do Quiet room difficulty Total 11,603 3,373 253 8 15,237 No difficulty 94 809 388 24 1,315 Some difficulty 0 8 138 16 162 A lot of difficulty 0 0 0 23 23 Cannot do 11,697 4,190 779 71 16,737 Total 16
Hearing Indicator (2013) Unweighted Frequency 14,976 Weighted Percent 90.6 1: low difficulty 2 6.2 1,156 3 2.2 404 4: high difficulty 1.0 201 Total 100.0 16,737 17
Cognition: Short/Extended set questions 1. Do you have difficulty remembering or concentrating? (SS) 2. Do you have difficulty remembering, concentrating, or both? 3. How often do you have difficulty remembering? (Frequency) 4. Do you have difficulty remembering a few things, a lot of things, or almost everything? (Intensity) Analyses conducted on Q2, Q3 and Q4 18
Do you have difficulty remembering or concentrating? SS (2013) Unweighted Frequency 13,719 Weighted Percent 83.2 No difficulty 2,632 14.7 Some difficulty 382 2.0 A lot of difficulty 20 0.1 Cannot do Total 16,753 100.0 19
Difficulty remembering: Intensity by Frequency (NHIS 2013) How much you have difficulty remembering (Intensity) How often do you have difficulty remembering (Frequency) a few things a lot of things almost everything Total sometimes 1,788 105 20 1,913 often 279 197 34 510 all of the time 51 84 80 215 Total 2,118 386 134 2,638 20
Remembering Indicator Unweighted Frequency 13,719 Weighted Percent 83.2 1: low difficulty 2 2,172 12.1 3 197 1.1 4: high difficulty 270 1.4 5: Concentrating only* 388 2.2 Total 16,746 100.0 21
Effect of adding difficulty concentrating *388 individuals with concentrating only were allocated as follows: 1. 357 with a little difficulty on the SS question were classified as 2 2. 30 with a lot of difficulty on the SS question were classified as 3 3. 1 with cannot do on the SS question was classified as 4 Those with both remembering and concentrating difficulty were upgraded 36 individuals from 2 to 3, and 125 individuals from 3 to 4 22
Cognition (2013) Unweighted Frequency 13,719 Weighted Percent 83.2 1: low difficulty 2 2,449 13.8 3 226 1.2 4: high difficulty 352 1.8 Total 16,746 100.0 23
Mobility: Short/Extended set questions SS Do you have any difficulty walking or climbing steps? 1. Do you have difficulty walking 100 yards on level ground, that would be about the length of one football field or one city block [without the use of your aid]? 2. Do you have difficulty walking a third of a mile on level ground, that would be about the length of five football fields or five city blocks [without the use of your aid]? 3. Do you have difficulty walking up or down 12 steps [without the use of your aid]? Analyses conducted on Q2, Q3 and Q4 24
Do you have difficulty walking or climbing steps? SS (2013) Unweighted Frequency 13,424 Weighted Percent 83.0 No difficulty 2,465 11.3 Some difficulty 792 3.9 A lot of difficulty 380 1.8 Cannot do Total 16,761 100.0 25
Difficulty walking 1/3 mile by difficulty walking 100 yards (NHIS 2010) Difficulty walking 1/3 mile Difficulty walking 100 yards No Some difficulty A lot of difficulty Cannot do difficulty Total 12,950 819 63 39 5,202 No difficulty 72 810 343 142 482 Some difficulty 3 21 301 166 198 A lot of difficulty Cannot do (380) 0 0 0 0 0 4,851 607 267 157 5,882 Total 26
Walking Indicator Unweighted Frequency 13,769 Weighted Percent 88.0 1: low difficulty 2 1,288 7.0 3 364 1.8 4: high difficulty 631 3.2 Total 16,052 100.0 27
Adding difficulty with steps Amount of difficulty walking up or down 12 steps Walking IndicatorNot at all Don't know A little A lot Completely Total 13,769 13,048 645 55 17 4 1 1,288 370 767 135 16 0 2 364 43 106 200 14 1 3 87 484 40 132 225 0 4 15,905 13,501 1,650 477 272 5 28
Mobility Indicator (2013) Unweighted Frequency 13,697 Weighted Percent 87.7 1: low difficulty 2 1,192 6.5 3 516 2.5 4: high difficulty 647 3.3 Total 16,052 100.0 29
Upper body: Short/Extended set questions 1. Do you have difficulty with self-care, such as washing all over or dressing? SS 2. Do you have difficulty raising a 2 liter bottle of water or soda from waist to eye level? 3. Do you have difficulty using your hands and fingers, such as picking up small objects, for example, a button or pencil, or opening or closing containers or bottles? Note: Q2 & Q3 are used for the upper body indicator. Q1 remains the self-care indicator. 30
Do you have difficulty with self-care, such as washing all over or dressing? SS (2013) Unweighted Frequency 16,029 Weighted Percent 96.2 No difficulty 544 2.9 Some difficulty 114 0.6 A lot of difficulty 68 0.3 Cannot do Total 16,755 100.0 31
Difficulty lifting 2 liter bottle by difficulty using hands/fingers (NHIS 2013) Amount of difficulty using hands/ fingers Amount of difficulty raising 2 liter bottle No Some difficulty A lot of difficulty difficulty Cannot do Total 14,786 309 58 44 15,197 No difficulty 782 355 51 40 1,228 Some difficulty A lot of difficulty 98 73 51 33 255 9 5 7 49 70 Cannot do 15,675 742 167 166 16,750 Total 32
Upper body Indicator (2013) Unweighted Frequency 14,786 Weighted Percent 89.5 1: low difficulty 2 1,446 7.8 3 331 1.7 4: high difficulty 187 0.9 Total 16,750 100.0 33
Pain: Extended set questions 1. In the past 3 months, how often did you have pain? (Intensity) 2. Thinking about the last time you had pain, how much pain did you have? (Frequency) 34
Pain Intensity by Frequency of pain in past 3 months (2013) Frequency of pain in past 3 months Pain Intensity Some days Most days Every day Never Total not asked 6,636 0 0 0 6,636 a little 0 4,136 323 401 4,860 in between 0 1,772 624 896 3,292 a lot 0 645 278 944 1,867 Total 6,636 6,553 1,225 2,241 16,655 35
Pain Indicator (2013) Unweighted Frequency Weighted Percent 1: low level 2 3 4: high level Total 11,095 3,442 1,174 944 16,655 68.3 20.1 6.6 5.1 100.0 36
Fatigue: Extended set questions 1. In the past 3 months, how often did you feel very tired or exhausted? (Frequency) 2. Thinking about the last time you felt very tired or exhausted, how long did it last? (Duration) 3. Thinking about the last time you felt this way, how would you describe the level of tiredness? (Intensity) 37
How long it lasted by How often felt very tired by Level of tiredness (2013) How often felt very tired: Frequency Level of tiredness: Intensity not asked a little How long it lasted: Duration not asked Some of the day Most of the day Never Some days Most days Every day Total 5,619 5,619 4,454 352 4,066 252 264 73 124 27 All of the day 68 15 18 101 In between Some of the day 2,224 400 166 2,790 Most of the day All of the day Some of the day Most of the day All of the day 497 194 536 297 237 266 71 165 255 118 123 84 84 160 230 886 349 785 712 585 a lot Total 5,619 8,371 1,627 1,016 16,633 38
Fatigue Indicator (2013) Unweighted Frequency Weighted Percent 1: low level 2 3 4: high level Total 9,949 3,864 2,312 508 16,633 61.1 22.7 13.4 2.8 100.0 39
Anxiety: Extended set questions 1. How often do you feel worried, nervous or anxious? (Frequency) 2. Thinking about the last time you felt worried, nervous or anxious, how would you describe the level of these feelings? (Intensity) 3. Do you take medication for these feelings? 40
Challenge to combining the questions into a single anxiety indicator Medication variable: what did taking medication for anxiety mean? Should everyone reporting medication use be considered anxious? Medication is an accommodation. (Prevalence of taking medication is 9.2%) What kind of medication are they taking? Are people reporting their anxiety with or without medication? 41
Anxiety: Frequency by Intensity (2013) How often feel worried/nervous/anxious: Frequency Level of feeling last time: Intensity A few times a year Daily Weekly Monthly Never Total Not asked 0 0 0 0 6,638 6,638 A little 489 887 897 3,417 44 5,734 In between 589 725 535 1,221 16 3,086 A lot 548 256 123 248 13 1,188 Total 1,626 1,868 1,555 4,886 6,711 16,646 42
Anxiety Indicator (2013) Unweighted Frequency Weighted Percent 1: low level 2 3 4: high level Total 11,597 3,656 845 548 16,646 70.2 22.1 4.9 2.9 100.0 43
Depression: Extended set questions 1. How often do you feel depressed? (Frequency) 2. Thinking about the last time you felt depressed, how depressed did you feel? (Intensity) 3. Do you take medication for depression? 44
Challenge to combining the questions into a single depression indicator Medication variable: what did taking medication for depression mean? Should everyone reporting medication use be considered depressed? Medication is an accommodation. (Prevalence of taking medication is 8.5%) What kind of medication are they taking? Are people reporting their depression with or without medication? 45
Depression: Frequency by Intensity (2013) How often feel depressed: Frequency Level of feeling last time: Intensity A few times a year Daily Weekly Monthly Never Total Not asked 0 0 0 0 9,785 9,785 A little 161 346 548 2,708 72 3,835 In between 209 384 378 1,042 35 2,048 A lot 381 191 112 248 35 967 Total 751 921 1,038 3,998 9,927 16,635 46
Depression Indicator (2013) Unweighted Frequency Weighted Percent 1: low level 2 3 4: high level Total 13,925 1,929 400 381 16,635 84.6 11.2 2.2 2.0 100.0 47
Disability prevalence: WG Extended set (18 years of age and over) 2010 2013 Weighted % Weighted % 9.5 Short Set 8.9 10.8 Extended Set1 9.8 11.6 Extended Set2 10.4 24.9 Extended Set3 (PFAD 3/4) 26.0 8.5 Extended Set4 (PFAD 4) 8.3 6.5 Extended Set (PF 4) 6.1 3.4 Extended Set (AD 4) 3.7 16.1 Extended Set5 14.2 13.3 Extended Set5 (minus PF) 12.0 48
Employment disaggregated by disability status: 18-64 years SS_1 ES_1 ES_2 ES_5 ES_5 (AD4/PF4) (minus PF4) (prevalence) 6.2 6.9 7.3 11.2 9.0 % working* Without disability 73.4 73.4 73.5 74.4 73.9 With disability 29.1 37.1 37.3 43.0 40.4 *What was you employment status last week? 49
