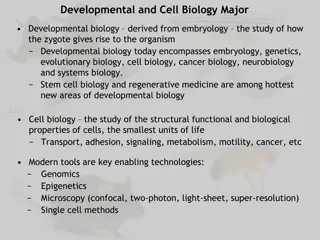
Strategies for Engaging Students in Biology Classes
Explore innovative teaching methods to move beyond memorization to foster scientific reasoning and student responsibility in biology education. Learn about effective strategies like reducing lecture time, utilizing online resources for base-level content, and providing ample practice for higher-level thinking skills. Discover how a reformed, high-structure approach can enhance student engagement and mastery of biology concepts.

Download Presentation

Please find below an Image/Link to download the presentation.
The content on the website is provided AS IS for your information and personal use only. It may not be sold, licensed, or shared on other websites without obtaining consent from the author. Download presentation by click this link. If you encounter any issues during the download, it is possible that the publisher has removed the file from their server.
E N D
Presentation Transcript
Engaging Students in Large Classes Kelly A. Hogan Department of Biology
She is very nice and her notes are in outline form and very organized. You don't even need to open the book. If you study her notes for the exams, you can ace all of them. Three semester exams with about 36 multiple choice questions. If you memorize her notes front to back, you can get a 100 on all of them. Overheard on a professor rating site
Was I really doing any better than this? How can I? Teach students to use scientific reasoning not memorization. Encourage all students to take responsibility for their learning.
I needed to: Lecture less (5-10 min at a time) Have students come to class with base-level content via reading and online homework. Give students lots of PRACTICE with the higher level thinking skills that aligned with my expectations on exams. Increase student engagement.
Traditional, Low Structure Biol 101 Attend Class and Fill In Outlines Review: SI, Tutoring
Reformed, High Structure Biol 101 Mastering Biology online HW (2X per week) Attend Class, Fill in Outlines, Clickers and Activities Textbook & Guided Reading Qs Review: SI, Tutoring,
Animal Tissues and Organ Systems Guided Reading Qs (Reading Chapter 20) 1. What major concept in biology is illustrated by the gecko s feet? 2. Draw a chart or graphic that illustrates your understanding of the hierarchy of the animal body: 3. How would you respond to this statement if you heard someone say it: A squid s eye has been perfectly designed to see in the dark depths of the ocean. Any words make you uncomfortable here? What concept might you find yourself teaching this person?
Mastering Biology: students master through practice. Study skill activities. (Ex: drag and drop) Teaching data interpretation and graphing through step through activities. High Bloom s level multiple choice questions.
In Class Activities: Actions: Materials:(can t pass out papers to 400 students efficiently) Pre-printed skeleton notes (may include extensive data or case studies) Index cards: easily passed, can be anonymous, easily collected Classroom response system: problem solving, data collection for in-class experiments, collecting misconceptions, pair and share Case studies/Guided Inquiry Demonstrations/role plays with students guiding students Brainstorming Write a question/Write an analogy Draw models Write figure legends for visuals Make predictions/Design experiments/Draw graphs Quizzing/Competitive games
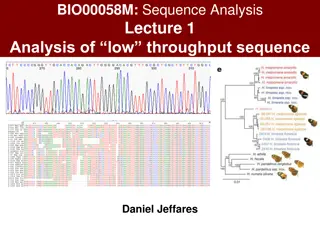
Objective: Read and Interpret Phylogenetic Evolutionary Trees. Homework: Textbook reading and online questions related to the tree below. In class: 1. (Low level thinking) Fill in partially blank tree they had previously seen in homework. 2. (Intermediate thinking) Interpretation of tree via clicker typical test question (TTQ). 3. (High level thinking/synthesis) Construction of their own tree applied to different groups.
Key course components Early outreach to students scoring low on first exam Face-to- Face Lecture Interactive class activities Mastering Biology homework Guided reading questions Class response system Session/Year Spring 2010 (Traditional, Low Structure) Spring 2011 3/wk No No No No No (Reformed, High structure) 3/wk Yes Yes Yes Yes Yes
* * Performance on exam 1 was significantly better in reformed semesters (Fall 2010 and Spring 2011 ) than the traditional semesters (Fall 2006 through Spring 2010) All students were better prepared!?
Maybe exam 1 was just easier in the reformed semesters.
% of questions per exam that were application or synthesis type questions. * A 33% B 36% D A C B 50% C D 36% Comparison of multiple spring semesters based on Exam 1 scores and Blooms analysis.
% of questions per exam that were application or synthesis type questions. * 33% 36% D A C B 50% 36% Comparison of multiple spring semesters based on Exam 1 scores and Blooms analysis. Conclusion: Data suggests that students were better prepared for their first exam with the high structure format.
% of questions per exam that were application or synthesis type questions. 61% 57% 58% 58% That better preparation does not continue through the semester, however. (Exam difficulty was similar between the redesigned and previous exams.)
Only exam 1 was correlating with better performance for students in the reformed course compared to students in the traditional class. There were no performance differences with Exam 2, 3, or the Final Exam This led us to question might certain subgroups of the population be benefiting more than others with the high structure? Might subgroup differences persist long term?
Nationally, what percentage of under-represented minority (URM) students receive a D or F in their introductory courses?
Why is performance from URM students lower? URM students are more likely to come from socioeconomically disadvantaged backgrounds and lower-quality schools than their non-URM peers. URM students come from backgrounds where they are less likely to have access to the knowledge and skills necessary for navigating the college environment. ( First generation .) Because of internalization of stereotypes, URM students often believe that they are not likely to succeed, regardless of their ability level. URM students are less able to find a niche for themselves. Rath et al. (2007); Massey et al. (2002)
What about UNC? What about my class? Hamilton 100 (Location of Biology 101). Seats > 400 students.
Proportion of URM College Students in BIOL 101 Receiving D/F Grades Source: UNC University Registrar # Students completed course % Black students % of D/F grades given to Black students 35.1 % 27.4 % 40.8 % % Hispanic students % of D/F grades given to Hispanic students 50% 12 % 11.8 % % White students % of D/F grades given to white students 18.2 % Term 72.1 % Fall 2006 Fall 2006 Spring 2007 Spring 2007 Fall 2007 Fall 2007 Spring 2008 Spring 2008 358 392 361 10.3 % 18.6% 13.6 % 5 % 6.4 % 4.7 % 62.0 % 8.2 % 68.1 % 7.7 % 66.5 % 8.2 % 331 17.5 % 24.1 % 4.5 % 13.3 % 66.0 % 62.2 % 8.1 % 5.8 % 335 360 363 14.3 % 18.9 % 19.3 % 37.5 % 25.0 % 35.7 % 4.5 % 8.6 % 5.7 % 20.0 % 3.2 % 23.8 % 61.7 % 6.7 % 73.6 % 6.9 % 314 11.8 % 24.3 % 5.0 % 23.0 % 8 semester average: 31% 20% 9%
Subgroup Comparison Four-Exam Comparison Before and After Redesign; * p value < 0.05 Spring 2010 (Traditional) Spring 2011 (Reformed) 4-exam Average 74.49% 57.17% 4-exam Average 75.57% 67.84%* Caucasian (n=241) African American Caucasian (n=238) African American (n=51) (n=47) Asian (n=31) Latino (n=17) Other (n=28) 74.33% 65.22% 67.36% Asian (n=37) Latino (n=23) Other (n=38) 75.80% 75.80%* 73.03% What do you conclude? - African American and Latino students performed better in the reformed course.
Performance gaps for each exam: Traditional Spring 2010 85 80 75 70 Caucasion African American Asian Latino Other 65 60 55 50 45 Exam 1 Exam 2 Exam 3 Final Exam 4 exam avg.
85 Caucasion 80 75 African American Asian 70 Traditional 2010 65 60 55 Latino 50 The gap lessens for African Americans but disappears for Latinos? Why? 45 Exam 1 Exam 2 Exam 3 Final Exam 4 exam avg. 85 80 75 Caucasian 70 Reformed 2011 65 African Amercan 60 Asian 55 50 Latino 45 Other Exam 1 Exam 2 Exam 3 Exam 4 4 exam avg
First Generation Students: Exam I Exam II Exam III Final Exam 4-exam average 71.48% 64.81% NON- First Gen First generation 62.75% 55.98% 78.44% 69.15% 73.39% 69.81% 71.33% 64.31% Exam I Exam II Exam III Final Exam 4-exam average 75.39% 70.89%* NON- First Gen First generation 74.90% 75.31% 74.44% 69.01% 79.24% 73.74% 72.98% 65.48% A significant difference was also noted in 4-exam average scores between first-generation students in the Spring 2011 course (70.9%) and those in the Spring 2010 course (64.81%).
What is happening? Leveling of playing field before class/increased course structure What do I know, what don t I know? Addresses issue of being underprepared by highschool Measurable increase in engagement 60 50 40 30 20 Traditional 10 Reformed 0 >4 hrs per week on class work Always reviewed notes after class NEVER contributed to class disucssions NEVER sought out TA or instructor
I learned so much from her! She uses Mastering Biology, which I really appreciated because it included so many study resources. Her lectures are interesting, and she provides an outline for you to fill out as she teaches. She also provides guided reading questions to complete before lectures, which I strongly recommend you doing. They are very helpful. SI sessions are available, and I have been told that they are very helpful (though I never went to one). Dr. Hogan REALLY cares about her students and provides tons of opportunities to get help if you need it. I loved her class and would recommend it to anyone. Overheard on a professor rating site
Personalizing the Biol 101 experience, how do they know I CARE? Transparency about my philosophy and my reasoning for each course component. Emails: sent after exams to high and low scorers and students that make big leaps. Invitation (nurturing tone) for low scorers to come do a Self Assessment survey with me. Heavily advertising and endorsing resources throughout the semester: Basic peer tutoring (advertised as for those who think they may fail the course ) Learning Center Tutoring (Extremely high quality!) Supplemental Instructor with peer TA Office hours
Students take responsibility when they respect you and think you care about their learning and their grade. Transparency about pedagogy set high expectations, but practice the expectations Invitations and interventions Students accept responsibility Be nurturing and on their side Treat students as adults Rules are rules
What next? Resources to continue improvement: A T.A. dedicated to helping me personalize the course (i.e. identifying students who fit into bins ) More support for Supplemental Instruction which correlate with better student performance Rath et. al, CBE LIFE SCIENCES EDUCATION. Sept 2007 Supplemental Instruction in Introductory Biology I: Enhancing the Performance and Retention of Underrepresented Minority Students . Classroom coaching on ways to better align my activities with learning outcomes.
What next? More statistical analysis to validate our findings with URM and first generation students in other reformed semesters. Haak et. al, SCIENCE, June 2011 Increased Structure and Active Learning Reduce the Achievement Gap in Introductory Biology . Identify the course components that have the biggest impact on reducing the performance gap. Learn what barriers the African American students face that may have disappeared in Latinos. Measure learning gains, not just performance.
Thanks to Lenovo Pearson Bob Henshaw Erika Bagley Suzanne Cadwell Jean DeSaix Center for Faculty Excellence IRB exempt: 11-1752
Spring 2010 (Traditional) Exam I Exam II Exam III Final Exam 4-exam Average 74.49% 64.67% 81.17% 77.23% 74.92% Caucasian (n=241) 49.85% 62.97% 61.43% 60.22% 57.17% African American (n=51) -14.8 66.05% -18.2 81.54% -15.8 76.37% -14.7 73.37% -17.32 74.33% Asian (n=31) 56.21% 74.07% 68.17% 62.41% 65.22% Latino (n=17) -8.5 -7.1 -9.06 71.15% -12.51 67.99% -9.27 67.36% 57.37% 72.91% Other (n=28)
Performance Gaps for each exam: Reformed Spring 2011 85 80 75 70 Caucasian African Amercan Asian Latino Other 65 60 55 50 45 Exam 1 Exam 2 Exam 3 Exam 4 4 exam avg
Spring 2011 (Reformed) Exam I Exam II Exam III Final Exam 73.21% 60.43% 4-exam Average 75.57% 75.54% 73.35% 74.17% 66.76% 79.27% 70.81% Caucasian (n=238) African American (n=47) 67.84%* -2.2 -7.41 78.32% -8.46 78.95% -12.8 71.78% -7.7 74.15% 75.80% Asian (n=37) 72.41% 73.92% 80.55% 75.91% Latino (n=23) 75.80%* -3.13 78.31% -0.3 +1.3 76.67% +2.7 71.78% +0.2 73.03% 65.34% Other (n=38)