Steelhead Migration and Behavior Study at Willamette Falls Dam
Detailed research conducted on the migration behavior and distribution of winter and summer steelhead radio-tagged at Willamette Falls Dam from 2012 to 2014. The study covers a wide range of topics including tributary escapement, Kelting behavior, repeat spawning, spatial and temporal overlap of steelhead, and the fate of recycled summer steelhead. The study also includes fixed-site monitoring data and analysis of environmental factors impacting steelhead migration. Results indicate variations in steelhead run sizes and distribution patterns over the years, as well as insights into the escapement of winter steelhead to tributaries.

Uploaded on Sep 23, 2024 | 0 Views
Download Presentation

Please find below an Image/Link to download the presentation.
The content on the website is provided AS IS for your information and personal use only. It may not be sold, licensed, or shared on other websites without obtaining consent from the author. Download presentation by click this link. If you encounter any issues during the download, it is possible that the publisher has removed the file from their server.
E N D
Presentation Transcript
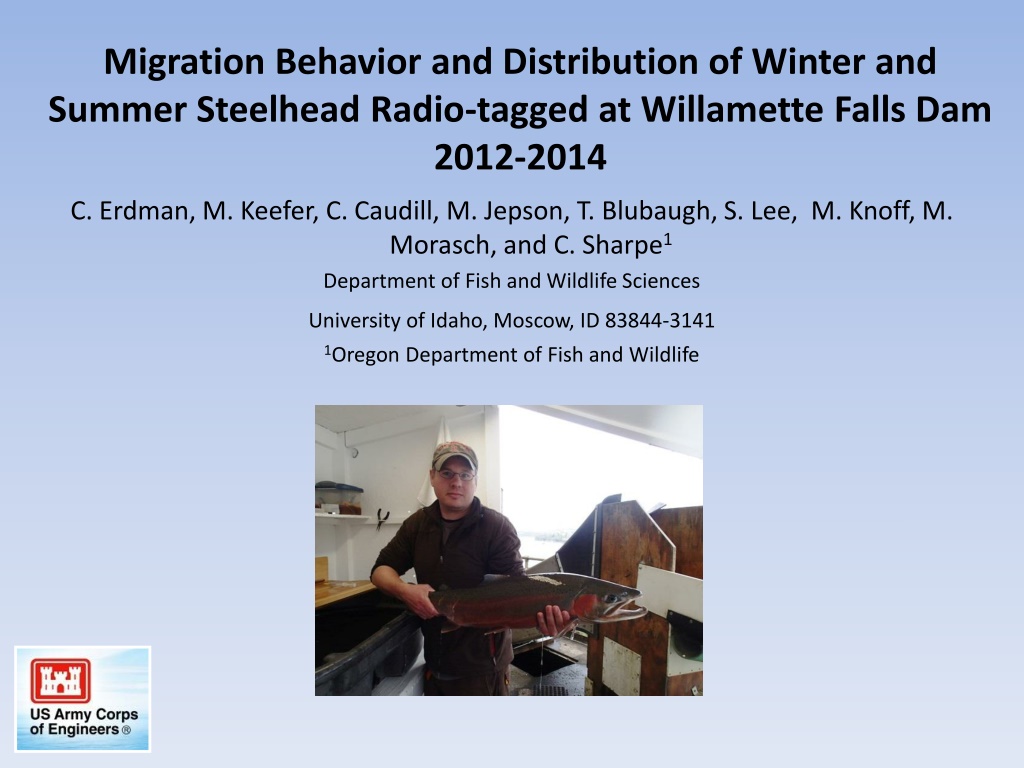
Migration Behavior and Distribution of Winter and Summer Steelhead Radio-tagged at Willamette Falls Dam 2012-2014 C. Erdman, M. Keefer, C. Caudill, M. Jepson, T. Blubaugh, S. Lee, M. Knoff, M. Morasch, and C. Sharpe1 Department of Fish and Wildlife Sciences University of Idaho, Moscow, ID 83844-3141 1Oregon Department of Fish and Wildlife
Radio-Tagged Steelhead at Willamette Falls Describe steelhead behaviors in mainstem and tributaries: Tributary escapement Kelting behavior Repeat spawning (iteroparity) Spatial and temporal overlap of winter and summer steelhead Radio-Tagged Recycled Summer Steelhead Fate of recycled summer steelhead
Fixed-site Monitoring WFD CLK WL1 WFU WL2 WL3 N. Santiam R. CAL WL4 S. Santiam R. WL5 McKenzie R. CFW Fall Creek Middle Fork
Results - Environmental Data Discharge (cms) Temperature (C) 25 2500 2012 2013 2014 20 2000 15 1500 10 1000 5 500 0 0 JanFebMarApr NovDec MayJun JulAugSepOct JanFebMarApr JulAugSepOctNovDec MayJun Date Date USGS 14174000 WILLAMETTE RIVER AT ALBANY, OR Data source = http://ida.water.usgs.gov/
Steelhead Run Sizes 700 2012 - 115% of 10 Yr. Avg. 600 Winter steelhead Summer steelhead 500 400 300 All SH - 10 Yr. avg. 200 Count at Willamette Falls Dam 100 0 700 2013 - 68% of 10 Yr. Avg. 600 500 400 300 200 100 0 700 2014 - 104% of 10 Yr. Avg. 600 500 400 300 200 100 0 31 Oct 1 Dec 1 Jan 1 Feb 1 Mar 1 Apr 1 May 1 Jun 1 Jul 1 Aug
Winter Steelhead Tags and Counts 20 300 2012 15 184 tagged (2.4%) 7,616 counted 200 10 100 5 Count at Willamette Falls Dam 0 20 0 300 2013 Tagged steelhead 170 tagged (3.4%) 4,944 counted 15 200 10 100 5 0 20 0 300 2014 212 tagged (4.0%) 5,349 counted 15 200 10 100 5 0 0 1 Apr 1 Jul 1 Aug 1 Mar 1 Jun 1 Dec 1 Jan 1 Feb 1 May 31 Oct Date
Run Timing Winter Steelhead 2002 2003 2004 2005 2006 2007 2008 2009 2010 2011 2012 2013 2014 Year 8 Feb 18 May 20 Dec 14 Jan 25 Nov 4 Mar 29 Mar 23 Apr Date
Winter Steelhead Escapement to Tributaries 2012-2014 Mean + 1 s.d. of tagged winter steelhead (%) 25 Unsuccessful Escaped to tributary n = 3 years Highest returns: 1) Santiam 2) Molalla 3) Middle Fork Range = 81-84% Mean = 83% 20 15 10 5 0 At Dam Molalla Tualatin Yamhill S Santiam L Santiam N Santiam McKenzie Calapooia Middle Fork L mainstem Fall Creek CoastFork Rickreall Clackamas U mainstem Dwnstrm Dam
Fates of early-run winter steelhead 2013 2014 200 10 Count at Willamette 34 tagged 839 counted (4%) Tagged steelhead 8 Falls Dam 6 100 4 2 0 0 31 Oct 15 Nov 1 Dec 15 Dec 1 Jan 15 Jan 1 Feb 15 Feb 40 Non-kelts Kelts Fate of tagged steelhead (%) Highest returns to Santiam & Molalla 30 Kelts = 29% (all tagged) 20 Kelts = 56% (escaping to tribs.) 10 ~50% did not escape to a tributary 0 Yamhill At Dam S Santiam L mainstem U mainstem Molalla Clackamas N Santiam Calapooia Dwnstrm Dam
Winter Steelhead Kelting Rates Return Frequencies 2012 2013 2014 2012 2013 2014 2012 2013 2014 All Yrs. 10 3 11 7 3 13 3 2 7 22 31 30 16 17 7 8 7 5 3 1 1 1 1 29 39 45 17 28 35 29 51 27 20 3 7 5 1 3 5 3 3 1 1 1 1 2 1 2 1 Middle Fork 33 7 18 11 Annual Total 150 142 178 87 81 Basin-wide rates similar among years Rates variable among populations and across years within populations Kelt Frequencies Kelt Rate (%) Rate (%) Clackamas Tualatin Molalla Yamhill Rickreall L Santiam S Santiam N Santiam Calapooia McKenzie Coast Fork Fall Creek 7 2 24 2 1 28 36 4 1 3 108 70 67 73 71 59 77 33 20 0 0 33 58 0 54 55 38 100 72 69 43 33 100 0 57 64 67 80 29 0 100 62 71 80 0 0 50 17 61 58 58 69 45 50 100 65 72 53 18 0 40 24
Winter Steelhead Kelt Behavior All Years Combined 50 n 45 TUA (11) Duration in tributaries varies Mean residence time (d) 40 35 (56) (71) (10) (84) MOL 30 SSTM YAM Insight into spawn timing 25 NSTM CAL (8) 20 (14) 15 CLK (13) WMF 10 1 Jan 1 Feb 1 Mar 1 Apr 1 May 1 Jun 1 Jul Mid-date of tributary residence
2012-2013 Winter Steelhead Life Histories 60 n = 230 Life History 2.2 2.3 3.2 2.2S3 1.2 3.3 3.2S3 2.3S4 1.3 2.4 1.2S3 4.2 1.4 2.2S3S4 3.3S4S5 % 2.2 Aging conducted by ODFW s FLHAP staff 52.2 18.3 10.9 3.5 3.0 2.6 2.2 1.7 1.3 1.3 0.9 0.9 0.4 0.4 0.4 50 40 Four most common life- history types identified 30 % 2.3 20 3.2 15 different life- history types 10 2.2S3 0 0 2 4 6 8 10 12 14 16 Life history types
2012-2013 Winter Steelhead Iteroparity Rates 25 (13) Freshwater entry during tagging Percent of tributary escapement 2nd time 3rd time All years combined: 20 (17) (6) 15 (63) (8) 8% 2nd spawners (8) (53) (346) (10) 10 (68) (15) (16) (35) 2% 3rd spawners 5 (30) 0 Total Yamhill At Dam Molalla Tualatin McKenzie Calapooia Clackamas S Santiam N Santiam Dwnstrm Dam Middle Fork U. Mainstem L. Mainstem
Summer Steelhead Tags and Counts 20 600 2012 15 195 tagged (0.8%) 24,103 counted 400 10 200 5 Count at Willamette Falls Dam 0 0 20 600 2013 Tagged steelhead 15 250 tagged (2.0%) 12,661 counted Temperature-related restrictions for late summers 400 10 200 5 0 0 20 2014 600 15 196 tagged (0.9%) 21,135 counted 400 10 200 5 0 0 1 Feb 1 Mar 1 Apr 1 May 1 Jun 1 Jul 1 Aug Date
Run Timing Summer Steelhead 2001 2002 2003 2004 2005 2006 2007 2008 2009 2010 2011 2012 2013 2014 Year 1 May 15 Jul 1 Aug 1 Apr 1 Jul 15 May 15 Jun 15 Aug 15 Apr 1 Jun 15 Mar Date
Summer Steelhead Escapement to Tributaries 2012-2014 40 Unsuccessful Escaped to tributary n = 3 years Highest returns: 1) S. Santiam 2) Middle Fork 3) McKenzie Range = 75-90% Mean = 82% Mean + 1 s.d. of tagged summer steelhead (%) 30 20 10 0 Molalla At Dam Santiam McKenzie Fall Creek S Santiam N Santiam Clackamas L mainstem Coast Fork Middle Fork Dwnstrm Dam U mainstem
Summer Steelhead Recaptures 2012-2014 Mean fate of tagged summer steelhead (%) 35 n = 3 years Non-recaptures Angler RCPs Hatchery RCPs 30 25 20 15 *Fish tagged at the Falls 10 5 0 Molalla At Dam Santiam McKenzie Fall Creek S Santiam N Santiam Clackamas L mainstem Coast Fork Middle Fork Dwnstrm Dam U mainstem Mean reported annual recaptures rates: Anglers = 18% Hatcheries = 8%
West side East side Fates in East and West Side Tributaries 2012-2014 40 2012 (n = 182) 2013 (n = 170) 2014 (n = 212) 30 Winter SH 20 Small but persistent returns to west side tribs. by winter SH 10 Percent of sample 0 No returns to west side tribs. by summer SH 40 2012 (n = 195) 2013 (n = 250) 2014 (n = 196) 30 Winters continue to return to Middle Fork, outside of Upper Willamette River Distinct Population Segment (DPS) 20 Summer SH Limited by lower flows and higher temps 10 0 Other Coast Fork N Santiam Fall Creek Clackamas Calapooia Yamhill Molalla Tualatin S Santiam McKenzie Middle Fork Rickreall Cr. Tributary
Winter/Summer Spatial Overlap Santiam River N. Santiam River 2012 summer steelhead Little N. Santiam River 1 1 1 1 1 3 5 1 1 7 5 1 1 1 1 1 1 1 3 1 Thomas Creek 1 3 2 1 2 1 1 Santiam River 1 N. Santiam River 7 1 2013 winter 1 3 4 1 Crabtree Creek steelhead 1 Willamette River 1 2 1 Middle Fork of Willamette River 1 8 S. Santiam River 1 2 11 4 1 1 1 1 1 Fall Creek 1 3 1 1 1 1 1 11 5 7 1 1 3 3 2 1 Dexter Reservoir Wiley Creek 1 1 2
Winter/Summer Spatial Overlap 2013 summer steelhead 1 Little N. Santiam River 14 1 7 2 1 1 1 1 3 1 8 N. Santiam River 1 Santiam River 1 1 2014 winter steelhead 12 2 Santiam River N. Santiam River 2 2 1 Thomas Creek Middle Fork of Willamette River 1 3 7 3 15 1 Crabtree Creek Willamette River 1 3 1 Fall Creek S. Santiam River 7 4 2 11 1 2 5 Dexter Reservoir 1 6 4 14 1 7 5 2 1 1 6 Wiley Creek
Winter/Summer Spatial Overlap Number of Radio-tagged Steelhead 2012 Summer Winter 8 3 1 13 31 8 1 2013 2013 Summer 1 1 1 2014 Winter 11 3 30 7 1 1 34 51 5 3 1 2 15 Clackamas Tualatin Molalla Yamhill Rickreall L. Santiam S. Santiam N. Santiam Calapooia McKenzie Coast Fork Fall Creek Middle Fork 30 21 32 29 7 3 38 7 28 50 1 24 1 7 3 24 Excludes: hatchery and angler recaptures winter SH detected/released > Foster summer SH exiting tribs before next year s winter SH tagged
Winter-Summer Temporal Overlap n Trib. Entry Winter SH Kelts (71) S. Santiam Tributary Trib. Exit Summer SH Kelts (2) (85) Winters N. Santiam (4) Summers (13) Middle Fork (6) May Nov Mar Jul Feb Aug Jun Jan Sep Oct Dec April Modest evidence for temporal overlap in Santiam No RT evidence in Middle Fork Van Doornik et al. (TAFS 2015) Summer Run Small N s for Summer Kelts Early Winter Run Late Winter Run
Genetic Stock Identification (GSI) Fin clips 180 individuals 50% winters, 50% summers 10 microsatellite loci Analyses not complete Results in reports
Recycled Summer Steelhead Below Foster and Dexter Dams: 2012-2014 Foster Dam Wiley Creek release Foster tailrace release South Santiam River Dexter release Waterloo County Park release Dexter Dam Middle Fork Willamette Foster Dam Pleasant Valley Boat Launch release South Santiam River
Fates of Recycled Summer Steelhead < Foster Dam All years combined: 70 Release Site n = 3 years Foster Tailrace Wiley Creek Pleasant Valley Boat Ramp Waterloo Country Park (n = 34) (n = 20) 9% recaptured by anglers 60 (n = 143) Percent of radio-tagged (n = 98) 50 recycled steelhead 30% recaptured at Foster Fish Facility 40 30 Greater angler recaptures of fish released closer to Foster 20 10 ~50% of recycled steelhead last detected in S. Santiam 0 Exited SSTM No Detections Stayed SSTM Other Recapture Angler Recapture Hatchery Recapture 9% exited S. Santiam Location of last detection
Fates of Recycled Summer Steelhead < Dexter Dam 60 All years combined: 2012 (n = 49) 2013 (n = 50) 2014 (n = 50) 50 18% reported recaptured by anglers Radio-Tagged Steelhead Percent of Recycled 40 Higher % of fish recycled at Dexter recaptured by anglers 30 20 10 ~54% last detected in Mid. Fk. Willamette 0 Other Recapture No Detections Hatchery Recapture Angler Recapture Exited Mid. FK. Wil. Stayed Mid. Fk. Wil. 26% exited the Mid. Fk. Willamette Location of Last Detection
Conclusions: Willamette Falls Tagging Sample years captured a reasonable range of environmental conditions among years Highest mean returns of winter steelhead to Santiam, Molalla, and M. Fork Highest returns of summer steelhead to S. Santiam, McKenzie, and M. Fork Winter steelhead kelting rates similar among years (58-61%) Summer steelhead kelting rates generally low Iteroparity rate higher in winter steelhead (~10%) Found spatial overlap in Santiam and Middle Fork Modest evidence for temporal overlap in Santiam small sample sizes
Conclusions: Recycled Steelhead Tagging 50% of summer steelhead recycled at Foster last detected in S. Santiam 54% of fish recycled at Dexter last detected in the Mid. Fk. Willamette 26% of recycled summer steelhead below Dexter left the Mid. Fk. Willamette Higher reported recapture of summer steelhead recycled at Dexter (18% vs. 9%) Higher % recaptured from release sites closer to Foster Dam
Acknowledgments NOAA Kim Hatfield, Stephanie Burchfield ODFW Wayne Vandernaald, Kanani Bowden, Ben Clemens, Todd Alsbury, Jeff Ziller, Tony Amandi, Kelly Reis, Michele Weaver, Shivonne Nesbit, Kirk Schroeder, Elise Kelly, Dan Peck, Tim Wright, Brett Boyd, Reed Fischer, Naomi Halpern OR Parks and Rec. Dept. Sara Griffith PGE Tim Shibahara USFWS Bonnie Johnson, James Bowker (INAD) USACE David Griffith, Robert Wertheimer, Glenn Rhett, Greg Taylor, Chad Helms, Doug Garletts UofI George Naughton, Tami Clabough, Theresa Tillson, Grant Brink, Kal Johnson
Coho Salmon Tags and Counts - 2014 1500 50 Number salmon radio-tagged Count at Willamette Falls 2014 Coho count 219 tagged (1.2%) 18,406 counted 205% of 10 year average 40 10 Yr. mean count 1000 30 20 500 10 0 0 1 Aug 1 Sep 1 Oct 1 Nov 1 Dec Date


")