Understanding Break-Even Analysis and Supply Chain Management Basics
Explore the fundamentals of break-even analysis and supply chain management through visual aids covering fixed costs, variable costs, production volume, economies of scale, and more. Gain insights into how these principles impact business operations.
- Break-even analysis
- Supply chain management
- Fixed costs
- Variable costs
- Production volume
- Economies of scale
Download Presentation

Please find below an Image/Link to download the presentation.
The content on the website is provided AS IS for your information and personal use only. It may not be sold, licensed, or shared on other websites without obtaining consent from the author. Download presentation by click this link. If you encounter any issues during the download, it is possible that the publisher has removed the file from their server.
E N D
Presentation Transcript
Breack-Even Analysis The Very Basic Model
Break-Even Analysis & Profit Margin Multiplier Ardavan Asef-Vaziri
Seven Principles of Supply Chain Management Operation costs are divided into 2 main groups: Fixed costs Costs of Human and Capital Resources wages, benefits, depreciation, rent, property tax and insurance. the total fixed cost is fixed throughout the year. No matter if we produce one unit or one million units. It does not depend on the production level. fixed cost per unit of production is variable. Variable costs Costs of Inputs raw material, packaging material, supplies, production water and power. The total variable costs depend on the volume of production. The higher the production level, the higher the total variable costs. variable cost per unit of production is fixed. Break-Even Analysis- Basics 3
Five Elements of the Process View Process Management Information structure Network of Activities and Buffers Inputs (natural or processed resources, parts and components, energy, data, customers, cash, etc.) Variable Outputs Goods Services Flow Unit Human & Capital Resources Fixed Break-Even Analysis- Basics 4
Total Fixed Cost and Fixed Cost per Unit of Product Total fixed cost (F) Fixed cost per unit of product (F/Q) Production volume (Q) Production volume (Q) Break-Even Analysis- Basics 5
Variable Cost per Unit and Total Variable Costs Variable costs Per unit of product (V) Total Variable costs (VQ) Production volume (Q) Production volume (Q) Break-Even Analysis- Basics 6
Diminishing Marginal Return Variable costs Per unit of product (V) Total Variable costs (VQ) Output Production volume (Q) Production volume (Q) Input Variable costs Per unit of product (V) Output Input Production volume (Q) Break-Even Analysis- Basics 7
Economy of Scall & Diseconomy of Scale Economies of scale Labor specialization Managerial specialization Efficient capital ------------- Diseconomies of scale Control and coordination problems Communication problems Worker alienation Shirking Dinosaur Effect Average Total Costs Per Output ATC-5 ATC-1 ATC-4 ATC-2 ATC-3 Long-Run ATC Output Control Size Break-Even Analysis- Basics 8
Total Costs TC = F+VQ Total Costs in $ (TC) Total Fixed cost (F) 0Volume of Production and Sales in units (Q) Break-Even Analysis- Basics 9
Total Revenue It is assumed that the price of the product is fixed, and we sell whatever we produce. Total sales revenue depends on the production level. The higher the production, the higher the total sales revenue. Price per unit (P) Total revenue (TR) Production (and sales ) (Q) Production (and sales) (Q) Break-Even Analysis- Basics 10
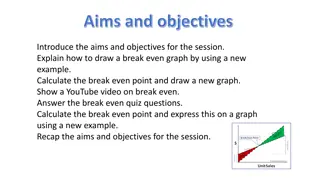
Break-Even Computations Total Costs or Revenue in $ (TC) TC=TR F+VQ=PQ QBEP = F/ (P-V) Break-Even Point Volume of Production and Sales in units (Q) Break-Even Analysis- Basics 11
BEP-Example $1000,000 total yearly fixed costs. $200 per unit variable costs $400 per unit sale price TR = TC 400Q= 1000,000+200Q (400-200)Q= 1000,000 Q= 5000 QBEP=5000 If our market research indicates that the present demand is > 5,000, then this manufacturing system is economically feasible. Break-Even Analysis- Basics 12
Financial Throughput and Fixed Operating Costs We define financial throughput as the rate at which the enterprise generates money. By selling one unit of product we generate P dollars, at the same time we incur V dollars pure variable cost. Pure variable cost is the cost directly related to the production of one additional unit - such as raw material. It does not include sunk costs such as salary, rent, and depreciation. Since we produce and sell Q units per unit of time. The financial throughput is Q(P-V). Fixed Operating Expenses (F) include all costs not directly related to production of one additional unit. That includes costs such as human and capital resources. Throughput Profit Multiplier = % Changes in Profit divided by % Changes in Throughput 1% change in the throughput leads to TPM% change in the profit Break-Even Analysis- Basics 13
Financial Throughput and Fixed Operating Costs Fixed cost F = $180,000 per month. Sales price per unit P = 22, and variable cost per unit V = 2. In July, the process throughput was 10,000 units. A process improvement increased throughput in August by 2% to 10,200 units without any increase in the fixed cost. Compute throughput profit multiplier. July: Financial Throughput = 10000(22-2) = 200000 Fixed cost F = 180,000 Profit = 200000-180000 = $20,000 In August throughput increased by 2% to 10200 August: Financial Throughput of the additional 200 units = 200(22-2) = 4,000 We have already covered our fixed costs, the $4000 directly goes to profit. July Profit was 20,000, in August it increased by 4,000 4000/20000 = 20% 2% Sales 20% Profit. 1% Sales 10% Profit. That is Throughput Profit Multiplier. Break-Even Analysis- Basics 14
A Viable Vision Eliyahu Goldratt A Viable Vision (Goldratt): What if we decide to have today's total revenue as tomorrow's total profit. In our example, Financial Throughput in July was Q1(P-V) = 10,000(22-2). In order to have your profit equal this amount we need to produce Q2 units such that: Q2(P-V) F = Q1(P) Q2(20) -180,000 = 10,000(22) Q2(20) = 40,000 Q2 = 20,000 In order to have your today's total revenue as tomorrow's total profit. We only need to double our throughput. Our sales, our current revenue becomes our tomorrow's profit. Break-Even Analysis- Basics 15
Break-Even Analysis -Math-Quiz (A) C(Q) =48 +3Q P=11 Fixed cost is 48 since it has no relation with Q Variable cost is 3 because for one unit increase in Q the cost will go up by 3 Total cost of making 18 pies C(18) = 48+3(18) = 102 Total cost of making 19 pies instead of 18 102+3=105 Total Revenue = Total Cost PQ=48+3Q 11Q=48+3Q 8Q=48 Q=6 Profit = Total Cost Total Revenue = Total Cost + Total Cost 11Q=2(48+3Q) 11Q=96+6Q 5Q=96 Q=19.2 Break-Even Analysis- Basics 16
Throughput Profit Multiplier Suppose we produce 10 units. What % increase in production and sales is needed to double the profit? That is what percentage increase in sales leads to 100% increase in profit. Q= 10 TC= F+VQ = 48+3Q = 48+3(10) = 78 TR= PQ=11(10) = 110 TP= TR-TC = 110-78 = 32 To increase profit by 100% we need to make 2(32) =64 TR-TC= 64 11Q-(48+3Q) = 64 11Q-3Q = 64+48 8Q = 112 Q= 14 14/10= 1.4 140% 40% increase 40% increase in sales leads to 100% increase in profit. Throughput Profit Multiplier = %Profit_Change/%Sales_Change Break-Even Analysis- Basics 17
Throughput Profit Multiplier -Second Example Fixed Cost = F = $120,000. Variable Cost = V = $20. Sales Price = P = $30. Contribution Margin = P=V = 30-20 = 10 to recover F and Produce Profit. We are making $10,000 profit. How many units do we produce (assume Production = Sales). TR = PQ. TC = F +VQ. TP = TR-TC = PQ-(F-VQ) = (P-V)Q-F. 10,000 = 10Q-120,000. 10Q= 130,000 Q = 13,000. Suppose sales is =increased by 10%. By what % will profit increase. Sales = 13,000+0.1(130,000) = 143,000. Break-Even Analysis- Basics 18
Throughput Profit Multiplier-Second Example TP = TR-TC = PQ-(F-VQ) = (P-V)Q-F TP = 10(14,300)-120,000 TP= 143,000-120,000= 23,000 Original profit was 10,000 Sales increased by 10% Profit went from 10,000 to 23,000 That is 13,000 increase 13,000 compared to 10,000 is 130% increase. 10%Sales leads to 130%Profit That is Throughput Profit Multiplier Break-Even Analysis- Basics 19
A Viable Vision-Goldratt By what % should we increase production (production = sales) to make our profit 5 years from now equal to our current sales. Current sales quantity = Q1= 13,000 Current sales revenue = TR= PQ = 30(13,000) = 390,000 Profit 5 years from now = 390,000 Our current profit is only 10,000 Therefore want to have (390000-10,000)/10,000= 38 we want to increase out profit 38 times. TP=TR-TC TP=PQ2-(F-VQ2) = (P-V)Q2-F 390,000= (30-20)Q2-120,000 10Q2=510,000 Q2=51,000 (Q2-Q1)/Q1 = (51,000-13,000)/13,000 =2.92 = under 3 times. Increase sales by 3 times, your profit will increase by 38 times Break-Even Analysis- Basics 20
 undefined
 undefined

