Overview of Genetic Variability in Marwari Breed of Indian Meat Goat

The presentation at the 2nd International Conference on Animal Dairy Science discussed the assessment of genetic variability in the Marwari breed of Indian meat goat using Microsatellite DNA by Prof. G.C. Gahlot from Rajasthan University of Veterinary & Animal Science, Bikaner. The global goat population distribution, with significant numbers in Asia and Africa, was highlighted. The top ten countries with the highest goat numbers, the ratio of goats to sheep, and goat population trends in India from 1970 to 2013 were also presented. The distribution of Indian goat populations across different regions was outlined, emphasizing the importance of the Marwari breed in the genetic assessment.

Download Presentation

Please find below an Image/Link to download the presentation.
The content on the website is provided AS IS for your information and personal use only. It may not be sold, licensed, or shared on other websites without obtaining consent from the author. Download presentation by click this link. If you encounter any issues during the download, it is possible that the publisher has removed the file from their server.
E N D
Presentation Transcript
2nd International conference on Animal Dairy Science Assessment of genetic variability in Marwari breed of Indian meat goat using Microsatellite DNA SPEAKER : PROF. G. C. GAHLOT RAJASTHAN UNIVERSITY OF VETERINARY & ANIMAL SCIENCE, BIKANER (RAJASTHAN), INDIA
Goat Population overview one goat to approximately 1.17 sheep in the world (FAOSTAT, 2013). The largest number of goats is observed in Asia, followed by Africa, representing about 59.4% and 35.0%, summing up to 94.4% out of the total number of the world, respectively. The ratios of goat to sheep in Africa, Central America and Asia are approximately equal, indicating the considerable importance of goat populations in these parts of the world, especially to the poor and landless peasants. The total number of goats in the world increased by 146% of the total number (1005.6 million) encountered in 1990. Number of goats in the world has been increasing since 1990 by about 1% to 4% each year. During the same period, cattle number increased by 5%, while that of sheep decreased by 10%, reflecting the emergence of goats as a major livestock species.
Table1:Numbers of goats in the top ten countries, the ratio of goats to sheep & their percentages from the total number in the world (FAOSTAT, 2013) Country Number (Million) Ratio Percentage of world total (%) Goats Goats Sheep Goat Sheep Sheep 1 China 182.89 185.00 1.01 18.19 15.77 1 India 162.00 75.50 0.47 16.11 6.437 1 Pakistan 64.90 28.80 0.44 6.454 2.456 1 Nigeria 58.25 39.00 0.67 5.793 3.325 1 Bangladesh 55.60 19.00 0.34 5.529 1.62 1 Sudan 44.00 52.50 1.19 4.375 4.476 1 Kenya 30.00 18.50 0.62 2.983 1.577 1 Ethiopia 25.00 26.50 1.06 2.486 2.259 1 Iran 22.10 50.22 2.27 2.198 4.282 1 Mali 19.12 13.73 0.72 1.901 1.171 1 World 1005.6 1172.83 1.17
Table 2: Number of goats in the India during the period from 1970 to 2013 (FAOSTAT, 2013) 180 162 160 154 Numbers (Million) 140 132.188 123.533 119.7 120 113.2 99.49 100 86.9 80 72.5 66.526 60 40 20 1970 1975 1980 1985 1990 1995 2000 2005 2010 2013 YEAR
INDIAN GOAT POPULATION DISTRIBUTION Temperate Region North-Western Region Gaddi, Changthangi, Chegu & Shingari Jamunapari, Beetal G O A T Southern Region Osmanabadi, Malabari, Sangamneri Western Region Sirohi, Barbari, Kutchi,, Mehasana, Zalawadi Surti & Marwari B R E E D Eastern Region Assessment of genetic variability in Marwari breed of Indian meat goat using microsatellite DNA Bengal, Ganjam, Assam Hill & Jakharana
Journey for survival and co-existence--- Looking beyond Boundaries Children normally herd goats, while their day-to- day management and the care of young stock usually fall to women. Women, children and old men together contributed 77-92% of labor requirements in goat rearing. Women alone contributed 32-55% to it (census of India, 2010
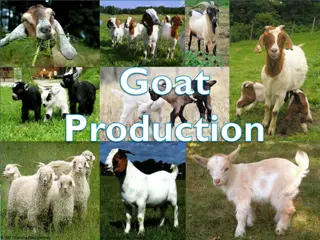
Marwari Breed Characters Home Tract : Bikaner, Jodhpur, Jaisalmer, Barmer, Pali and Nagour districts. Utility : Meat and Milk Morphology : Medium sized body, predominantly black with long hairs occasionally white or brown patches. Hair : Lustrous hair grows with 11 to 12 cm per annum. Horns: 8.60 to 12.20 cm long, twisted, pointed and directed upwards and backwards Ears : 12.58 to19.13 cm long hanging downwards. Body dimensions Milk yield :84 5.7 kg to 113 7.0 kg Twinning : 15-20 % Height : 60-80 cm Length : 40-67 cm Hearth girth: 68-80 cm Pouch girth: 70-88 cm Adult Wt. : Male:40-45 kg Female:35-40 Kg 8
OBJECTIVE: To account of the existing within-breed genetic variability in Marwari goat Materials and methods Blood samples were randomly collected from 146 genetically unrelated animals of Marwari goat from different villages of Bikaner districts of Rajasthan in line with MoDAD recommendations (FAO, 1998). Genomic DNA was extracted from whole blood using proteinase K digestion followed by standard phenol chloroform extraction procedure at room temperature (Sambrook et al., 2001) with few modifications. PCR-based microsatellite DNA typing using standard protocol. All electrophoresis on 0.8% agarose gel containing ethidium bromide extracted samples were confirmed through horizontal Microsatellite markers: A panel of 15 microsatellite markers were selected from the list recommended by International Society for Animal Genetics (ISAG) and FAO s (DAD-IS) for Caprine.
Table 3 : A panel of 15 microsatellite markers used in the study Locus Primer sequence Type repeat (CA)17 of Size range Chromoso me No. 05 Annealing Temp. (in 56.0 C) TACTCGTAGGGCAGGCTGCCTG GAGACCTCAGGGTTGGTGATCAG GATCACCTTGCCACTATTTCCT ACATGACAGCCAAGCTGCTACT GGAAGCAATGAAATCTATAGCC TGTTCTGTGAGTTTGTAAGC GCT TGC TAC ATG GAA AGT GC CTA AAA TGC AGA GCC CTA CC AAGGGACCTCATGTAGAAGC ACTTTTGGACCCTGTAGTGC AGTCTGAAGGCCTGAGAACC CTTACAGTCCTTGGGGTTGC TCC AGA TTT TGT ACC AGA CC GTC ATG TCA TAC CTT TGA GC CTGCAGTTCTGCATATGTGG CTTAGACAACAGGGGTTTGG TATTAGAGTGGCTCAGTGCC ATGCAGACAGTTTTAGAGGG AAGGGTCTAAGTCCACTGGC GACCTGGTTTAGCAGAGAGC AGTCACCCAAAAGTAACTGG ACA TGT TGT ATT CCA AGT GC GCCTTACTACCATTTCCAGC CATCCTGACTTTGGCTGTGG GCTGAACAATGTGATATGTTCAGG GGGACAATACTGTCTTAGATGCTGC GCTGCAAAGAGTTGAACACC AACTATTACAGGAGGCTCCC AGC AGA CAT GAT GAC TCA GC CTG CCT CTT TTC TTG AGA GC 92-122 ETH-152 (CA)18 146-160 14 ETH-225 54.0 (nn)39 174-190 10 ILSTS-005 52.8 (CA)11 167-173 14 ILSTS-011 54.0 (TG)10 142-162 Ann ILSTS-019 53.7 (GT)21 186-202 Ann ILSTS-022 55.0 (CA)7 132-150 11 ILSTS-028 50.4 (CA)13 159-179 2 ILSTS-030 54.0 (CA)12 151-187 12 ILSTS-033 54.6 (GT)29 153-185 5 ILSTS-034 51.0 (GT)20 142-170 Ann ILSTS-044 50.0 (GT)15 136-188 17 ILSTS-058 54.0 (CA)4(GT)2 105-135 13 ILSTS-059 55.0 (CA)22 105-135 24 ILSTS-065 53.7 (CA)14 110-120 28 ILSTS-087 50.0
PCR-amplified products were resolved on 6% ureaPAGE denaturing sequencing gel at 75 W (Sequi Gen GT apparatus. Bio- Rad, Hercules, USA) and visualized by silver staining (Bassam et al. 1991). Allele sizes were estimated using a 100-bp ladder (Invitrogen Life Technologies, Carlsbad, USA). Genotype of each individual animal at 25 different loci was recorded by direct counting.
Analysis of molecular data Genotype of each individual animal was determined and recorded from the silver-stained microsatellite locus. gels for each Different measures of within-breed genetic variations, namely number of alleles, allele frequencies, effective number of alleles (ne), observed heterozygosity (Ho), expected heterozygosity (He), were estimated to evaluate variability at DNA level. Polymorphism information content (PIC) for each locus was calculated according to Botstein et al. (1980).
RESULTS A total of 74 alleles were contributed by Marwari goat across all 15 microsatellite loci. The number of alleles per locus varied from two (ILSTS-087) to 9 (ILSTS-058) alleles, with a mean of 4.93 whereas the effective number of allele varied from 1.35 (ILSTS-005) to 3.129 (ILSTS011) with a mean of 2.36. The effective number of allele is lesser than observed number at all the loci. Allelic sizes ranged from 125 bp (ILSTS-028 and ILSTS-033) to 650 bp (ILSTS-011 and ILSTS-019). The expected heterozygosity ranged from 0.240 (locus ILSTS- 005) to 0.681 (locus ILSTS-011), with an average value of 0.544.
The observed heterozygosity (Ho) ranged from 0.1428 (locus ILSTS-087) to 0.9285 (locus ILSTS-034), with an average value of 0.5485 indicates substantial and very good number of heterozygotes, in the population. The highest polymorphic information content (PIC) value (1.1886) was observed at ILSTS-044 locus and least (0.0768) at ILSTS-065 locus for Marwari goat. Reasonably high PIC values observed for most of the marker with an average of (0.78096) are indicative of the usefulness of microsatellites biodiversity evaluation in this breed.
Table 4: Number and size of the alleles, heterozygosity and PIC in Marwari goat. Microsatellite Marker No. of Allele Ao Allele size(bp) Heterozygosity Ho PIC Ae H(Exp) ETH-152 4 2.515 150-200 0.4285 0.603 1.1306 ETH-225 5 2.755 140-200 0.500 0.637 1.1448 ILSTS-005 3 1.315 175-350 0.2857 0.240 0.6425 ILSTS-011 7 3.129 350-650 0.5714 0.681 0.9385 ILSTS-019 5 2.932 145-650 0.7857 0.660 1.2057 ILSTS-022 4 2.143 200-350 0.5714 0.534 0.1065 ILSTS-028 4 1.44 125-245 0.4285 0.305 0.8264 ILSTS-030 6 2.853 150-310 0.6428 0.650 1.1608 ILSTS-033 4 2.939 125-175 0.514 0.655 0.1862 ILSTS-034 6 2.68 200-250 0.9285 0.627 1.1759 ILSTS-044 5 2.995 150-550 0.6428 0.666 1.1886 ILSTS-058 9 2.652 175-550 0.714 0.623 0.1279 ILSTS-059 5 1.988 150-250 0.7857 0.497 1.1534 ILSTS-065 5 2.099 145-550 0.2857 0.524 0.0768 ILSTS-087 2 1.34 150-200 0.1428 0.254 0.6498 Average 4.93 2.385 0.5485 0.544 0.78096
Conclusions Based on the PIC values, the microsatellite primers used in the present study are proved to be highly polymorphic in nature and hence can be well utilized for molecular characterization of goat germplasm. The PIC values are suggestive of high polymorphic nature of the microsatellite loci analysed. The PIC values observed in the present study is indicative of the fact that the markers used are highly informative for characterization of Marwari goat diversity. The significant level of variability in this population reflects that the Marwari population contains a valuable genetic diversity. Hence, this population could provide a valuable source of genetic material that may be used for meeting the demands of future breeding programmes.
Allelic profile across the 15 microsatellite markers in Marwari goat on PAGE
Figure : Allelic frequency distribution across the 15 microsatellite markers in Marwari Goats.


 ranged from 0.1428")