Understanding Fish Population Dynamics through Size Structure Analysis
The concept of size structure analysis provides valuable insights into various aspects of fish population dynamics, including recruitment, growth, fishing mortality, and natural mortality. By examining length frequencies and proportional size distributions, researchers can better understand the composition and dynamics of fish populations.
- Fish Population Dynamics
- Size Structure Analysis
- Length Frequencies
- Proportional Size Distribution
- Fisheries Management

Uploaded on Sep 30, 2024 | 2 Views
Download Presentation

Please find below an Image/Link to download the presentation.
The content on the website is provided AS IS for your information and personal use only. It may not be sold, licensed, or shared on other websites without obtaining consent from the author. Download presentation by click this link. If you encounter any issues during the download, it is possible that the publisher has removed the file from their server.
E N D
Presentation Transcript
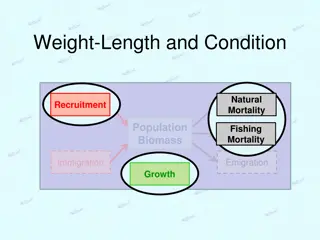
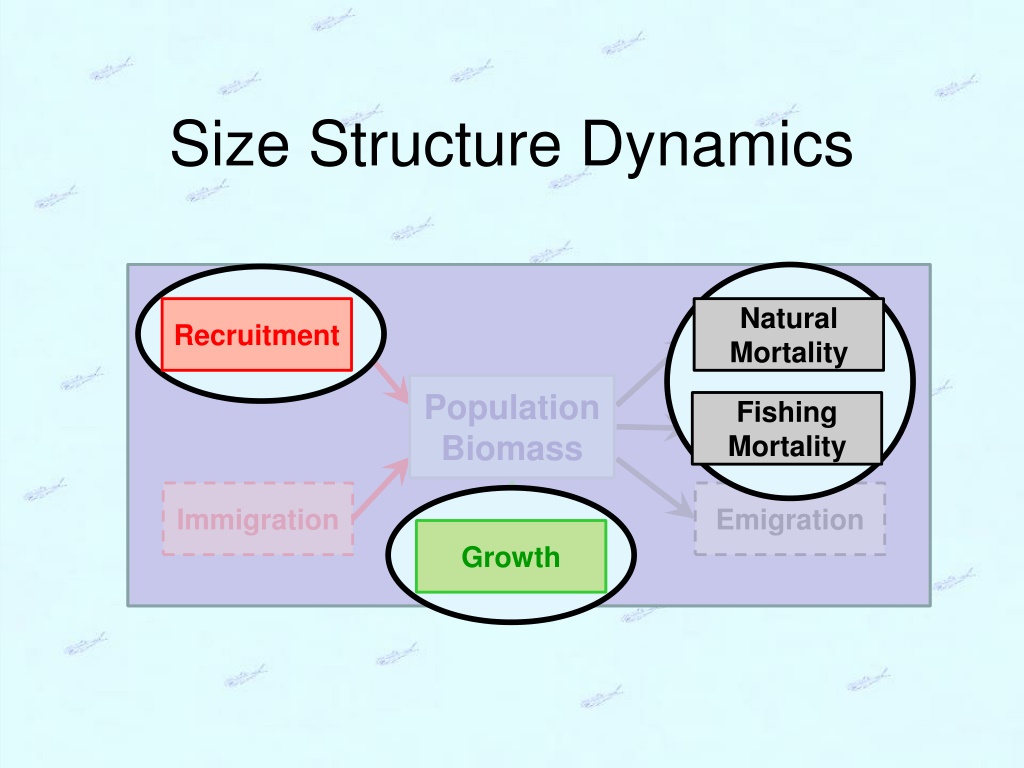
Size Structure Dynamics Natural Mortality Recruitment Population Biomass Fishing Mortality Immigration Emigration Growth
Size Structure Methods Length frequencies Proportional Size Distribution (PSD) was Proportional Stock Density Proportional Size Distribution (PSD-X) was Relative Stock Density 2 Size Structure
Length Frequency Use common breaks depending on fish size and sample size 2, 5, 10, or 25 mm 0.1, 0.25,0.5,or 1 in 100 80 Number of LMB 60 40 20 0 5 10 15 20 3 Size Structure Total Length (inches)
Size Structure Concept Recruitmentcontrols numbers in smaller length bins. Growthcontrols fish moving into larger length bins. Fishing mortality controls fish removal from larger length bins. Natural mortalitycontrols fish removal from smaller length bins and, without compensatory mortality, larger length bins. Natural Mortality Natural Mortality Frequency Thus, size structure analysis provides insight on many aspects of population dynamics! Recruitment Growth Fishing Mortality 5 10 15 20 25 Length 4 Size Structure
Length Frequency -- Example From Stone and Lott. 2002. North American Journal of Fisheries Management 22:975 984 5 Size Structure
Length Frequency -- Example 6 Size Structure From Paukert and Willis. 2001. Fisheries Management and Ecology 8:533-542
Length Frequency in R Do Class Exercise I 7 Size Structure
Why fewer 6 than 10 fish? Size structure summaries are heavily influenced by the relative selectivity of the gear used. Frequency 5 10 15 20 25 Length 8 Size Structure
Gillnet -- Selectivity Total selectivity is related to three parts of catch process encounter contact retention from Anderson, C.S. 1998. Partitioning total size selectivity of gill nets for walleye (Stizostedion vitreum) into encounter, contact, and retention components. Can. J. Fish. Aquat. Sci. 55: 1854 1863. 9 Size Structure
Gear Selectivity Do Class Exercise II 10 Size Structure