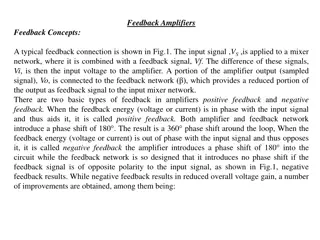
Lightning Validation Tools and User Feedback in Lightning Data Analysis
GLM Lightning Validation Plans by Monte Bateman, Doug Mach, Rich Blakeslee, Bill Koshak, and Steve Goodman involve assessing the accuracy and reliability of lightning data tools. Users find value in these products for decision-making in outdoor events involving lightning concerns. The tools help in visualizing lightning jumps, tracking storm severity, and identifying areas of storm intensification. User feedback highlights strengths in detecting intensity changes and weaknesses related to data dropouts. The Valid framework evaluates GLM performance relative to other data sources, providing a comprehensive overview for users.

Download Presentation

Please find below an Image/Link to download the presentation.
The content on the website is provided AS IS for your information and personal use only. It may not be sold, licensed, or shared on other websites without obtaining consent from the author. Download presentation by click this link. If you encounter any issues during the download, it is possible that the publisher has removed the file from their server.
E N D
Presentation Transcript
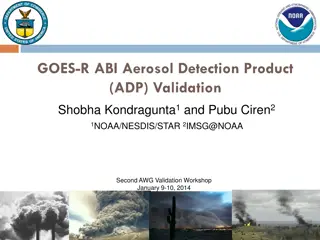
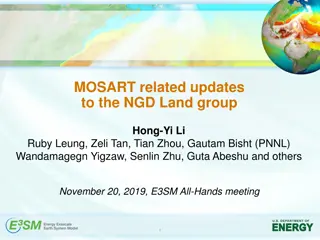
GLM Lightning Val Plans Monte Bateman, Doug Mach, Rich Blakeslee, Bill Koshak & Steve Goodman
I. Product Generation & Assessment Proxy products: GLM events, groups, and flashes Pseudo-GLM (pGLM) Validate Lightning Data (Valid) tool User engagement activities NWS comments Proving Ground 2013 Spring program used pGLM National Lightning Jump Demonstration uses pGLM data
User Comments compiled by Geoffrey Stano 2013 Spring Program I can see value in this product during the summer in helping with decision support during big outdoor events where lightning is a concern. Strengths to me were trends in the flash density products. The strength of the lightning data was being able to visualize the lightning jumps related to updraft intensification. The most notable weakness was the data dropouts, which made it difficult to find consistency with respect to time. The strengths were a good correlation with "lightning jumps", ie rapid increases in lightning density and increases in storm severity in terms of large hail. There were very few weaknesses in the products today as we had storms in good coverage areas. The lightning data was very beneficial in linear modes to decipher which storms were the most severe within the line.
User Comments compiled by Geoffrey Stano, 2 2013 Spring Program The lightning data did well picking up on jumps in intensity. This helped signify areas were storms were likely to intensify or already doing so. It definitely helped in detecting where storms were strengthening or weakening quickly. I found the flash extent density to be extremely useful, especially with the sub-severe convection it offered a glimpse in the storms intensity between volume scans and offered a way to monitor their growing intensity. The flash extent density was the best one because it s the simplest to use and process in a rapidly developing warning situation.
Val Tools VALID overall framework; ingests lightning data from all available sources (other satellites & ground-based networks) Overview: Data Match tool (shown later) Evaluates performance of GLM relative to one or more sources (automatic or user selected) Data Match product is a stoplight chart map UI will allow user to click on a problem area, invoking the deep-dive tool, displaying histograms and time-series behind the warning
Field Programs CHUVA 2012 Multi-sensor field campaign, centered in Sao Paulo See plot next IPHEX 2014 Multi-aircraft field campaign, based in SW Georgia Working on an airborne GLM simulator
Field Programs CHUVA 2012 Sample lightning data from CHUVA LIS (grey squares) simulate GLM
II. Algorithm Enhancements Beyond Baseline No enhancements to date Prepared to implement L2 filters if needed e.g., an artifact passing through the L1b filters Any modifications or enhancements will be transitioned to operations as needed
III. Post-Launch Test (PLT) & Post-Launch Validation From Sample PLT Requests for GLM 10 Jun 2013 Detection Efficiency Validation Tests comparison with other sources Threshold Change Tests Decrease & Increase Laser Beacon Test (if available) INR, geolocation, energy cals (events & background)
Post-Launch Test (PLT) & Post-Launch Validation, 2 From Sample PLT Requests for GLM 10 Jun 2013 Background Signal Validation Test LIS, Vicarious targets: DCC, Deserts, glint, etc. Lightning Signal Validation Tests LIS, TARANIS Continuing Current Detection Tests
Spatial & Spectral Calibration Underflights: Use data from airborne radiometers/spectrometers and other instruments Comparison with LIS & TARANIS Laser beacon cals
QA Tools Check for errors, artifacts: ghosting, cross-talk, glint L1b filter assessment Statistical analysis of events Assess the uniformity of the CCD & degradation over time
Instrument Health Monitor housekeeping data; alarm for low/high Background radiance trending & analysis Glint prediction and monitoring Log: threshold values, instrument commands & responses, spacecraft attitude changes
Example of Data Match Tool Data: Match product: Green: all saw Yellow: GLM + 1 other saw red: ground saw; GLM missed GLM proxy: blue boxes ENI flashes: red dots NLDN flashes: purple Xs This GLM proxy is generated from LMA data, so it is range-limited. Past that range, it s all red. This is a good test for this tool.


 &")
 &")