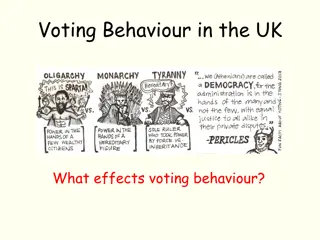
Voting Trends and Civic Engagement Statistics in the USA
Empowering voters and defending democracy are crucial aspects of civic engagement, as highlighted by the League of Women Voters. The data presented includes voter turnout rates, voting trends, and the impact of selected winning candidates in various elections from 1940 to 2018. The visuals illustrate voter registration and turnout rates by geographic area, as well as the votes of winning candidates in specific elections. These statistics provide insights into the participation of the voting-eligible population and the importance of every vote in shaping electoral outcomes.

Uploaded on Oct 01, 2024 | 0 Views
Download Presentation

Please find below an Image/Link to download the presentation.
The content on the website is provided AS IS for your information and personal use only. It may not be sold, licensed, or shared on other websites without obtaining consent from the author. Download presentation by click this link. If you encounter any issues during the download, it is possible that the publisher has removed the file from their server.
E N D
Presentation Transcript
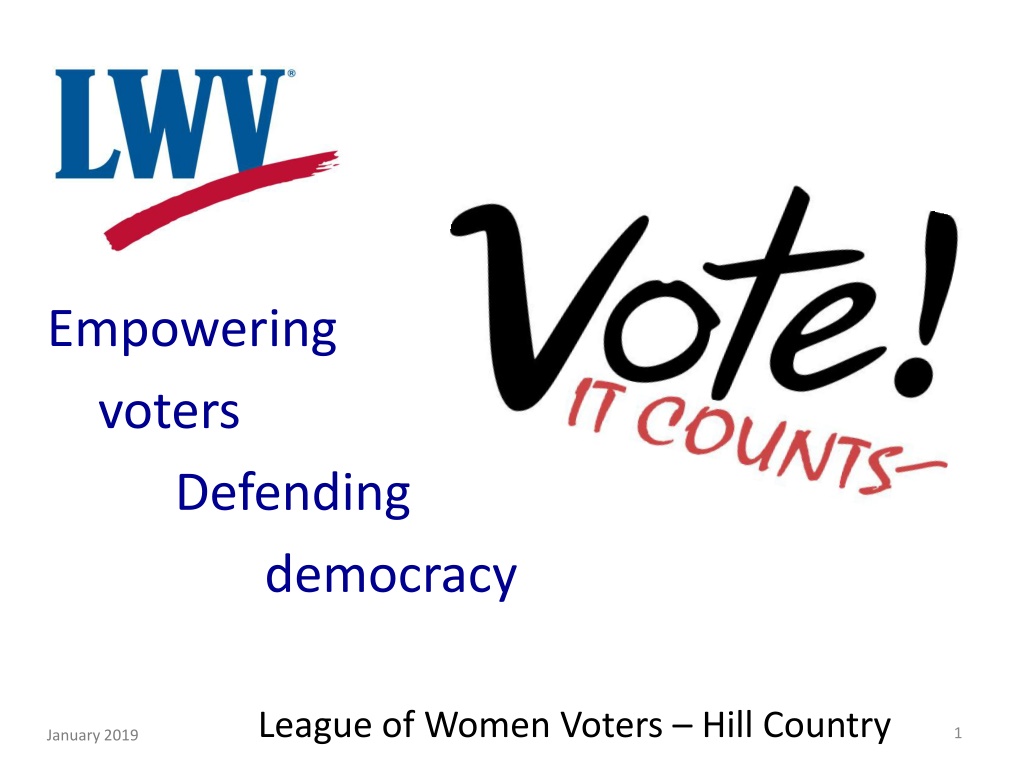
Empowering voters Defending democracy League of Women Voters Hill Country 1 January 2019
% Voting Eligible Population* That Voted, U.S., Presidential Elections, 1940-2016 64 65 62 62 60 60 Percent 55 56 52 52 50 1940 1948 1960 1972 1996 2008 2016 *Voting eligible population (VEP) = population 18+ years adjusted for noncitizens and felons ineligible to vote. 3
% Voting Eligible Population That Voted, by Type Election, Texas & U.S., 2000-18 70 62 61 60 60 59 55 54 54 52 50 50 50 49 46 42 Percent 41 41 40 37 35 33 31 30 28 28 25 20 15 13 11 10 0 2000 2002 2004 2006 2008 2010 2012 2014 2016 2018 TX Pres Primary TX General U.S. General *Voting eligible population (VEP) = population 18+ years adjusted for noncitizens and felons ineligible to vote. 4
Voter Registration & Turnout Rates (% CVAP), by Geographic Area, 2016 Presidential Election 95 100 89 88 80 64 61 60 52 Percent 40 20 0 United States Texas Hill Country Area Registered Voted *Citizen voting age population (CVAP) = population 18+ years adjusted for noncitizens ineligible to vote. 5 League of Women Voters
Voter Registration & Turnout Rates (% CVAP), by Geographic Area, 2016 Presidential Election 120 * 102 98 98 95 92 91 90 100 82 71 68 80 66 65 64 Percent 60 60 55 60 40 20 0 Registered Voted * Unknown data error in Secretary of State & Census Bureau data. Data sources available upon request 6
% Votes of Selected Winning Candidates, May 2014 Texas Primary Runoff Republican Lt. Governor Runoff Patrick won with 65% of votes Votes represented < 4% registered voters Democratic U.S. Senate Runoff Alameel won with 72% of votes Votes represented 1% registered voters 7
Does your vote count? Vote Difference (No.), by Type Election, Year, Winning Candidate, & Geographic Area Election Year Winning Candidate Votes Area Presidential 2000 George W. Bush 537 FL U.S. Senate 2008 Al Franken 312 MN State Senate State Rep. School Dist. State Rep. City Council 1948 Lyndon Johnson 87 TX 2016 Rodney Anderson 64 TX 2016 Anne Sung 7 TX 2010 Donna Howard 4 TX 2016 Bettina Jordan 1 TX District #105, Dallas/Irving/Grand Prairie. Houston ISD. District #48, Austin. City of Hutto. 8
Will you Register? Update registration? Vote by mail? Vote early? or Vote on Election Day? Got a plan? Be a Texas Voter! Dates to Remember
Voter Information Websites VoteTexas.gov Texas Secretary of State 1-800-252-VOTE Who When Where - How - What VOTE411.org Election Information You Need Enter your address to get personalized election information LWVHillCountryTexas.org A local nonpartisan resource for local voting & public policy issues LWVTexas.org A nonpartisan resource for voting & state public policy issues League of Women Voters 11
County Election Websites Early Voting & Election Day Times, Locations, Sample Ballot Bandera County 830-796-8146 www.banderacounty.org <Election Administrator> Edwards County 830-683-2235 www.co.edwards.tx.us <Elections> Gillespie County 830-997-6515 www.GillespieCounty.org/page/election_info Kendall County 830-331-8701 www.co.kendall.tx.us <County Departments> <Elections> League of Women Voters 12
County Election Websites Early Voting & Election Day Times, Locations, Sample Ballot Kerr County 830-792-2242 www.co.kerr.tx.us./elections Kimble County 325-446-3353 www.co.kimble.tx.us/ <County Offices> <County Clerk> Real County 830-232-5202 www.co.real.tx.us/ <County Offices> <County Clerk> League of Women Voters 13
Plan to be a voter How difficult will it be for you to be a voter in the upcoming election? 14 Cartoon from http://raesidecartoon.com/vault/voting-3/


, by")
, by")