Solid Waste Management Department FY2017 Overview
The presentation provides an in-depth look at the Solid Waste Management Department's FY2017 preliminary budget, organizational structure, operational details, demographic data, staffing tenure, and initiatives. Highlights include residential collections, recycling programs, disaster management response, and workforce demographics. The department's key focus areas, leadership, and strategic direction for the upcoming fiscal year are outlined.

Download Presentation

Please find below an Image/Link to download the presentation.
The content on the website is provided AS IS for your information and personal use only. It may not be sold, licensed, or shared on other websites without obtaining consent from the author. Download presentation by click this link. If you encounter any issues during the download, it is possible that the publisher has removed the file from their server.
E N D
Presentation Transcript
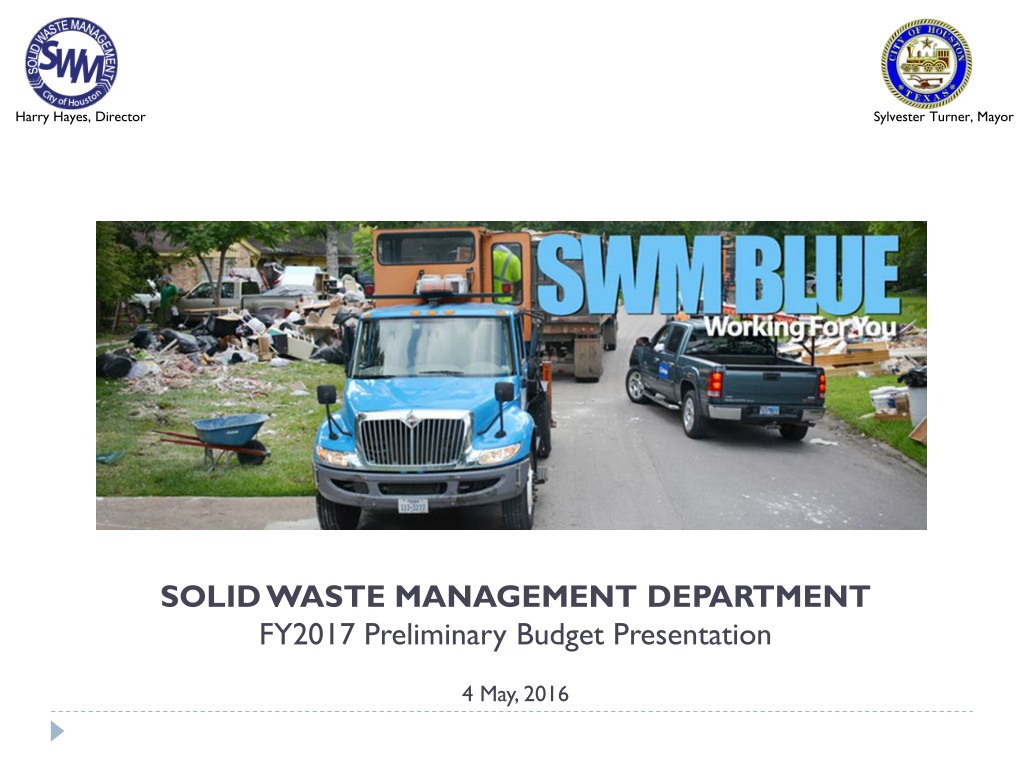
Harry Hayes, Director Sylvester Turner, Mayor SOLID WASTE MANAGEMENT DEPARTMENT FY2017 Preliminary Budget Presentation 4 May, 2016
Department Organizational Chart Harry Hayes, Director Sylvester Turner, Mayor Director Chief of Staff Deputy Director South Operations Assistant Director Finance & Administration Deputy Director North Operations Deputy Assistant Director Southeast Service Center Deputy Assistant Director Northeast Service Center Deputy Assistant Director Southwest Service Center Deputy Assistant Director Northwest Service Center Senior Superintendent Facilities Maintenance 2 4 May 2016
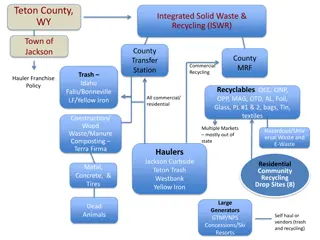
Department Operations Harry Hayes, Director Sylvester Turner, Mayor Residential Collections 1x weekly, 20,072,000 Annually Yard Waste Collections 1x weekly, 20,072,000 Annually Tree/Junk Waste 1x Monthly, 4,632,000 Annually Curbside Recycling 1x Bi-weekly, 10,036,000 Annually Neighborhood Recycling Centers 6 Staffed Locations 4 Self-Service Locations Re-Use Warehouse Environmental Services Mobile BOPA, HHW Events Environmental Centers Disaster Management Response Allison 01, Rita 05, Ike 08, Memorial Day 15, Halloween 15, Tax Day 16 Deal Animal Collection 3 4 May 2016
FY2016 - Demographic Data Harry Hayes, Director Sylvester Turner, Mayor SWM Demographic data by ethnicity o The department is comprised of: o 78% African American o 16% Hispanic/Latino o 4% White o 2% Asian/Pacific Islander 18 (4%) 7 (2%) 74 16% Asian/Pacific Islander Black or African American Hispanic/Latino White 349 (78%) o 77% of the department is male; 23% female SWM Demographic data by gender & ethnicity 300 250 200 Personnel Male 150 Female 100 50 0 Asian/Pacific Islander Black or African American Hispanic/Latino White 4 4 May 2016
FY2016 Staffing Tenure Harry Hayes, Director Sylvester Turner, Mayor Number of employees Average tenure of employee Employee group Executive Managerial Administrative Operations Total 9.0 45.0 31.0 372.0 457.0 19.6 15.7 10.9 7.0 8.4 5 4 May 2016
Department FY2017 Initiatives Harry Hayes, Director Sylvester Turner, Mayor o General update to Chapter 39 of the Code of Ordinances o Finalize advanced routing management and tracking system to increase route productivity o Partner with Legal and Strategic Purchasing Department (SPD) on the release of a RFP for a new Recycling Services contract o Long Range Waste Diversion & Solid Waste Plan Request for Proposal (RFP) to be issued in Q1 FY2017 6 4 May 2016
Plan Houston Interface Harry Hayes, Director Sylvester Turner, Mayor Plan Houston Core Strategy Department Goals & Initiatives Maintain well managed and operational solid waste system. On time service and proactive enforcement within budget. Scrap Tire Program. Zika abatement. Advocate strong recycling programming. Keep Houston Beautiful, Private Waste Haulers, Major Management & Trade Organizations Sustain Quality Infrastructure Safe and healthy neighborhoods Protect and conserve our resources Support our global economy Partner with others, public and private 7 4 May 2016
FY2017 General Fund Budget Expenditures FY2017 General Fund Budget Expenditures Net Change to FY2016 Current Budget Harry Hayes, Director Sylvester Turner, Mayor FY2016 Current Budget FY2017 Proposed Budget Incremental increase 75,771,536 $ 79,163,385 3,391,849 $ Growth (%) 4.5% Explanation of Incremental Increase/(Decrease) Contractual/Mandated Increases: HOPE Allowance (including FICA & Pension) Municipal Pension 29.36% Restricted Accounts Allowances Recycling Fund Adjustment Subtotal contractual/mandated increases 895,663 385,571 264,172 4,139,688 5,685,094 $ Cost Savings/Decreases Approved Budget Reduction Subtotal cost savings/decreases (2,293,245) (2,293,245) $ Incremental increase over FY2017 3,391,849 $ 8 4 May 2016
General Fund Expenditures by Category Harry Hayes, Director Sylvester Turner, Mayor General Fund Expenditures by Category (Fund 1000) Personnel Services Supplies Other Services and Charges Equipment Non-Capital Equipment Debt Service & Other Uses Total Expenditures FY2016 Estimates 31,915,747 $ 5,201,739 35,667,358 145,269 2,839,823 75,771,536 $ Variance (FY16 vs FY17) 1,285,901 $ 131,313 2,889,604 (145,269) (768,100) 3,391,849 $ FY2015 Actual FY2016 Budget FY2017 Budget Variance (%) 31,148,814 $ 5,625,192 34,555,380 250,000 3,214,786 74,793,572 $ 31,915,747 $ 5,201,739 35,667,358 145,269 2,839,823 75,771,536 $ 33,201,648 $ 5,333,052 38,556,962 2,071,723 79,163,385 $ 4.0% 2.5% 8.1% -100.0% -100.0% -27.0% 4.5% (600) - - 1,600 1,600 (1,600) o Personnel Services Increases due to health benefits, pension contribution and municipal employees union contract Supplies and Services Increases in Interfund vehicle services Other Services and Charges Increases due to Zika Abatement Debt Services and Other Uses Reduction to Debt Service costs o o o o o o o 9 4 May 2016
FY2017 Performance Measures Harry Hayes, Director Sylvester Turner, Mayor FY2015 Actual FY2016 YTD FY2016 Budget FY2016 Estimate FY2017 Budget Customer Measures Priorities Residential Units Serviced Q 377,610 386,232 386,232 386,232 390,094 Solid Waste Recycling Rate F,Q 30% 30% 30% 30% 30% Tons Collected F,Q 628,978 414,848 623,166 611,676 674,719 FY2015 FY2016 FY2016 FY2017 Business Process Measures Priorities Actual Budget Estimate Budget Expenditure Budget vs. Actual Utilization Revenues Budget vs. Actual Utilization F 1 1 1 1 F 111% 100% 103% 100% 10 4 May 2016
Questions? Harry Hayes, Director Sylvester Turner, Mayor 11 4 May 2016