Understanding Probability: Learning Outcomes and Examples

This content delves into the study of probability, covering topics such as representing probabilities of simple and compound events, calculating relative frequencies, multi-step chance experiments, theoretical and experimental probabilities. It explains concepts like chance experiments, sample space, outcomes, events, and provides examples for calculating both theoretical and experimental probabilities. Understand how to express probabilities as fractions, decimals, or percentages and discover the relationship between theoretical and experimental probabilities.
- Probability
- Learning Outcomes
- Theoretical Probability
- Experimental Probability
- Calculating Probabilities

Download Presentation

Please find below an Image/Link to download the presentation.
The content on the website is provided AS IS for your information and personal use only. It may not be sold, licensed, or shared on other websites without obtaining consent from the author. Download presentation by click this link. If you encounter any issues during the download, it is possible that the publisher has removed the file from their server.
E N D
Presentation Transcript
Students will be learning: Outcomes A student represents probabilities of simple and compound events. (MA4 21SP) A student calculates relative frequencies to estimate probabilities of simple and compound events. (MA5.1 13SP) A student describes and calculates probabilities in multi-step chance experiments. (MA5.2 17SP)
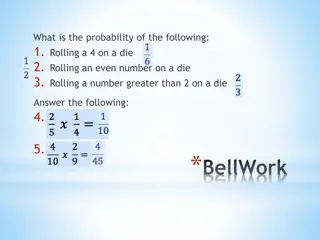
Chance Experiment In the study of probability, a numerical value based on a scale from 0 to 1 is used to describe levels of chance.
Experiment is an activity that may produce a variety of different results that occur randomly. E.g. Rolling a die Trials - One occurrence of an experiment E.g. rolling a die for 50 times, tossing a coin for 20 times Sample space - All the possible outcomes of an event E.g. {1, 2, 3, 4, 5, 6} Outcome - One of the possibilities from a chance experiment E.g rolling a 5 Event -is either one outcome or a collection of outcomes.
A probability can be written as a fraction, decimal or percentage. If the number of trials is large, the experimental probability should be very close to the theoretical probability.
Venn diagrams A diagram using circles to show the relationships between two or more sets of data
Mutually exclusive Two events that cannot both occur at the same time. For e.g.
Create a Venn diagram. From a class of 30 students, 12 enjoy cricket (C), 14 enjoy netball (N) and 6 enjoy both cricket and netball.
Activity- Illustrate the information in a Venn diagram. From a group of 50 adults, 35 enjoy reading Fiction (F), 20 enjoy reading non- fcction (N) and 10 enjoy reading both fiction and non- fiction.
Activity- Illustrate the information in a Venn diagram. At a show, 45 children have the choice of riding on the Ferris wheel (F) and/or the Big Dipper (B) .35 of the children wish to ride on the Ferris wheel, 15 children want to ride on the Big Dipper and 10 children want to ride on both.
Two-way tables - use rows and columns to describe the number of elements in different regions of overlapping events.
Using tree diagrams I flip two coins, what is the probability that I get two heads? Coin 1 Coin 2 1 2 1 2 P(HH) = x = 1 2 Heads 1 4 Heads 1 2 1 2 P(HT) = x = 1 2 1 4 1 2 Tails 1 2 1 2 P(TH) = x = 1 2 Heads 1 4 1 2 Tails x = 1 2 1 2 1 4 P(TT) = 1 2 Tails Probabilities on each branch add up to 1 Possible outcomes are shown on the end of the branches Multiply along the branches to work out the probabilities
Using tree diagrams I have a bag of counters, 3 blue and 7 red. I pick one counter out without looking and put it back in the bag, I then pick out another counter. What is the probability that I pick out a red counter and a blue counter? Sweet 1 Sweet 2 7 10 7 10 P(RR) = x = 7 10 49 100 Red Red 7 3 10 P(RB) = x = 7 10 21 100 10 3 10 Blue 7 10 7 10 P(BR) = x = 3 10 21 100 Red 3 Blue 10 3 10 P(BB) = x = 3 10 9 3 10 Blue 100
Task Grade C/B - Completing tree diagrams with probabilities like example 1 Grade B - Completing tree diagrams with probabilities like in example 2 Grade B/A Extension More complex tree diagrams and probabilities. You can only move onto to this once you have completed at least Q3 and 4 of Silver
Plenary 2ndMatch 1stMatch Calculate the probability of me winning both my bets Win Win Lose Calculate the probability that I win at least one of the bets Win Lose Lose
Self-Assessment Today I am working towards a grade I have shown I can Grade C draw a tree diagram Grade B calculate independent probability using a tree diagram Grade B/A calculate more complex probabilities My next step is to
Using tree diagrams Example 1 I flip two coins, what is the probability that I get two heads? Coin 1 Coin 2 P(HH) = Heads P(HT) = P(TH) = Tails P(TT) = Probabilities Possible outcomes Multiply
Using tree diagrams example 2 I have a bag of counters, 3 blue and 7 red. I pick one counter out without looking and put it back in the bag, I then pick out another counter. What is the probability that I pick out a red counter and a blue counter? P(1 red and 1 blue) = Sweet 1 Sweet 2 6 9 P(RR) = Red 7 P(RB) = 10 P(BR) = P(BB) =
Summary Probability review REVISION Venn diagrams and two-way tables Using arrays for two-step experiments Using tree diagrams Using relative frequencies to estimate probabilities