Workforce Data Integration Across Three States: Behind the Scenes in Missouri, Kansas, and Massachusetts
Explore the innovative approaches to workforce data integration in Missouri, Kansas, and Massachusetts in this revealing look at regional models and strategies implemented in October 2017. Delve into the collaborative efforts among partner agencies from various sectors to enhance data systems and drive workforce development initiatives, paving the way for improved outcomes and informed decision-making. Discover the key components of the longitudinal data systems, supplemental noncredit data files, school and program information, performance data metrics, and planned enhancements for Phase 3.

Download Presentation

Please find below an Image/Link to download the presentation.
The content on the website is provided AS IS for your information and personal use only. It may not be sold, licensed, or shared on other websites without obtaining consent from the author. Download presentation by click this link. If you encounter any issues during the download, it is possible that the publisher has removed the file from their server.
E N D
Presentation Transcript
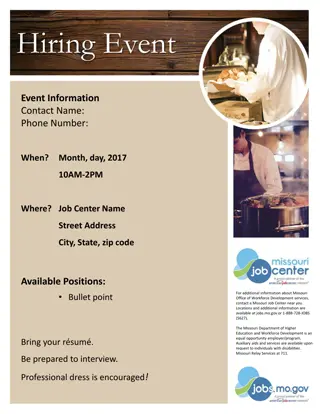
Workforce Data Integration: Three States, Three Models, Three Regional Approaches! A look behind the scenes in Missouri, Kansas, and Massachusetts October 2017
MCCA MoWINs Grant Director Missouri Community College Association DAWN BUSICK-DRINKARD
Partnerships Partner Agencies Economic Development Higher Education Elementary & Secondary Education Labor and Industry Relations Social Services
Missouris Longitudinal Data System Early Childhood data K-12 data DESE Public two and four-year inst. Graduate characteristics DHE Data Warehouse End User TANF data SNAP - Food Stamp - data Workforce Programs FSD Interagency Data Governance Work Group DWD UI status Benefits file DOLIR
School & Program Info Demographics Age Gender Race/Ethnicity
Performance Data: Median Wage Credential Rate Employment Rate Top Industries Potential Careers
Performance Data: Median Wage Credential Rate Employment Rate Top Industries Potential Careers
Phase 3 Planned Enhancements: Add career exploration tools Integrate occupational projections Modify WIOA ETPS system to allow data uploads of course information More detailed reporting Begin Outreach efforts for public engagement
Regional Training Data Graduates by degree level Average wage Region of employment Top industries of employment Demographics
Go LIVE date - January 2018! Thank you, Mrs. Dawn Busick-Drinkard MoWINs ConsortiumDirector dawn.drinkard@mccatoday.org 573-634-8787
KanTRAIN Director Washburn University of Topeka DEBRA MIKULKA
Developing Partnerships Kansas Model Background: 19 Community Colleges and 6 Technical Colleges: Independently Governed Kansas Board of Regents = Statewide Coordinating Board 5 Kansas Workforce Areas Washburn as lead for Rounds 1 (TRAC-7) and 4 (KanTRAIN) consortium TAACCCT grants
Systems Alignment Statewide Longitudinal Data System grant (SLDS) for P-20 July 2010 - June 2014 for KSDE & KBOR Workforce Data Quality Initiative (WDQI) (2013-16) and (2015-18) for Commerce & Labor Consortium (perspective) alignment of workforce, industry, & education: TRAC-7 focus on statewide education and workforce, then regional education by industry KanTRAIN focus on regional education, industry and workforce
KanTRAIN Two-Tier Partnership Model Transitioned from the TRAC-7 State model: State: KBOR & Commerce Grant Sites Industry LWIBs To the KanTRAIN Two-tiered Systems & Practice model: Grant-based State alignment with IHE-based Regional/Local alignment National industry partners Consortium Leadership State: Commerce State: KBOR Site-based Reporting KBOR Site-based Industry Relationships IHE-based Leadership LWIB Relationships
Lessons Learned: Partnerships Focus: Systems vs. Practice: Different roles and expectations for different outcomes Sustainable Leadership: Who owns it Grant-focus vs Sustainable Systems focus or both
KanTRAIN Data Hub KBOR Data, Research & Planning Implement integrated system of postsecondary data collection, maintenance, analysis and reporting Coordinate the Integrated Postsecondary Education Data System (IPEDS) for all KS higher education institutions Design and implement a state-wide postsecondary database system Develop electronic data collection and reporting systems
KanTRAIN Data Warehouse Model Used existing systems Created new linkages Developed new report Integrated student records, program, data, LMI Added WIOA Support Services KSDE PK - 12 KBOR Data Warehouse KDOL Commerce: LMI Workforce
LMI Information & Planning How it was: IHEs KBOR KDOL LWIBs Utilizing current systems to create new linkages: IHEs LWIBs KDOL KBOR
Lessons Learned: Data Sharing Confidentiality of Student Data Data Sharing & Storage Building on Established Agreements Embedded Practice & Sustainability
Collaborative, Sustainable Data Systems: Embedded Practice KBOR Electronic data collection & reporting systems: IHEs, Labor, KBOR Workforce-IHEs: Workforce support services, Campus- based Workforce staff, Co-Enrollment, Information- Sharing and Tracking IHE-KBOR: Expanded Reporting (ID) Industry-IHEs: Responsive & Predictive Reporting (ID)
Lessons Learned: Data Integration and Planning Considerations . Time Money Shared Resources Partners Working Together Persistence Patience Targeted Goals
Statewide Project Director, GPSTEM Massasoit Community College Kathleen Kirby
Community Colleges are not a centrally managed system No standing data sharing agreements between state agencies No wage matching between higher education and workforce for three years No legislation No WRIS 2 No consistent/formal reporting of noncredit workforce data Legitimate concern regarding the use of college program performance data in an era of performance-based funding Environm ent Overview
At the same time. . . drive toward closing middle- skills gap desire to align education and training programs to meet workforce demands commitment to higher ed as economic engine (in MA specifically) belief that community colleges have a positive story to tell
GPSTEM Data Integration Project Overview Process 1. Hired external vendor 2. Discussion around sustainability 3. Interest from/Collaboration with EOE and DHE 4. Intense work began 2017 Four (easy??) pieces: 1. Student Pathways Application 2. Credit for Prior Learning Site massexperiencecounts.com launched! 3. Research and Reporting Tools 4. Scorecard
Student Pathways Application Connect jobseekers and prospective students with high-demand careers and relevant academic programs. Deliver a tailored and comprehensive Action Plan, detailing critical next steps.
Student Pathways Application Overview Access & Referrals Assess Experiences & Preferences Select College Program View High-Demand Job Opportunities Filter Job Opportunities Market and bring prospective students to the application Gain an understanding of the applicant s matching characteristics Connect applicants with applicable college programs Show applicants high- demand and relevant job options Narrow potential opportunities
Match Engine Overview Wanted Analytics, BLS ONET, Student Job Families Student Jobs aligned to interests Interest Profiler Jobs Data Qualifying Questions Programs aligned to preferences Program Mapping College Selection Program/Cours e Colleges Student, MSA
Prospective Student Career Action Plan
STATUSStudent Pathways Application Secured jobs data feed Burning Glass Data Interfaces with BLS, O*Net created DHE will feed college program of studies info Colleges inputting contact info for Admissions personnel Outreach and Marketing phase begins October Final integration of branding then launch! (November) Maintenance will be assumed by EOE at end of TAACCCT grant (Oct. 2018)
Research & Reporting Tool In-depth analysis and research in the hands of researchers, faculty and workforce development staff. Longitudinal data about the efficacy of academic programs, and state-wide labor market demand.
Community College Degree and Certificate Graduation Outcomes Report Number Graduated within 100% of time Number Graduated within 150% of time Number Graduated within 200% of time Number Graduated within 300% of time Entering Cohort Year Community College Degree or Certificate Race/ Ethnicity Gender Pell-eligible CIP at initial institution Meta-major 14 Grade MCAS Performance Levels or other levels Special Ed at any time in high school ELL at anytime in high school Free and Reduced Price Lunch at anytime in high school
Workforce Outcomes Reports Student Employment Outcomes Student Employment High-Growth Industries Transfer Student Employment Outcomes Adult Learner Employment Outcomes Report Institution-Level Employment Outcomes Trend Non-Completer Employment Outcomes Occupational Requirements Available 2019 WIOA Report (available 2019) Perkins Employment Outcomes Report (available 2019) Non-Credit Workforce Development Activity Employment Outcomes Report (available 2019) Data Sources: HEIRS, Wage Matched Records, Burning Glass LMI, O*Net, BLS, Census
Student Employment Outcomes Report Number Employed Percent Employed Average/Median/ Percentiles Earnings Graduating Cohort Year Years After Graduation (1, 3, 5 or 1, 5, 10) Community College Race/ Ethnicity Gender Pell-eligible Age Group at Graduation Degree/ Certificate level completed Degree CIP Meta-major Industry Code
STATUS: Research and Reporting Contracted with DHE/EOE Secured data analytic tools Burning Glass Data Interfaces with BLS, O*Net, Census created Roll out to campuses October/November
CHALLENGES Finalizing wage match agreement A lot of cooks. . . . BENEFITS For the FIRST TIME, colleges will be able to see employment outcomes for program completers Very in-depth, robust reports available to colleges at one click Alignment with WIOA regionalization push
Scorecard Product of Research and Reporting PDF organized by meta-majors Plus website with dropdowns enabling comparison of programs (aggregate) Earnings, retention in employment, graduation rates, transfer rates Finalizing content to be approved by presidents Design PDF and website
Questions? The product was created by the grantees and does not necessarily reflect the official position of the U.S. Department of Labor. The Department of Labor makes no guarantees, warranties or assurances of any kind, express or implied, with respect to such information, including any information on linked sites and including, but not limited to, accuracy of the information or its completeness, timeliness, usefulness, adequacy, continued availability, or ownership. This work is licensed under the Creative Commons Attribution 4.0 International License. To view a copy of this license, visit http://creativecommons.org/licenses/by/4.0/.