Child & Family Wellbeing Indicators Report 2015 Overview
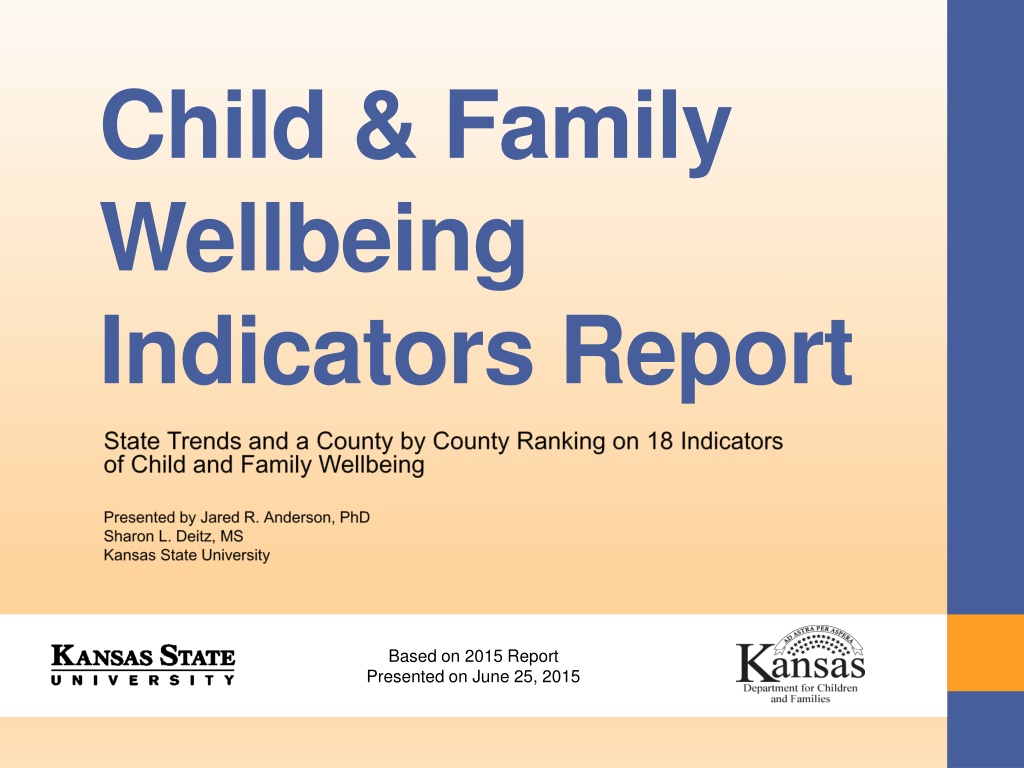
This report presents indicators of child and family wellbeing based on the 2015 findings, aiming to aid government officials, policymakers, and community leaders in understanding the state of child and family wellbeing in Kansas counties. The report provides insights on 18 key indicators, including child poverty, parental unemployment, teen pregnancy, and more, allowing for targeted interventions and improvements in local communities. County spotlights such as Bourbon, Crawford, and Labette also provide demographic and socioeconomic data for further analysis.

Download Presentation

Please find below an Image/Link to download the presentation.
The content on the website is provided AS IS for your information and personal use only. It may not be sold, licensed, or shared on other websites without obtaining consent from the author. Download presentation by click this link. If you encounter any issues during the download, it is possible that the publisher has removed the file from their server.
E N D
Presentation Transcript
Child & Family Wellbeing Indicators Report Based on 2015 Report Presented on June 25, 2015
PURPOSE Overview of state-level trends and a county by county comparison on indicators of child and family wellbeing. Aid government officials, policymakers, community leaders, faith organizations, helping professionals, and Kansas citizens understand the state of child and family wellbeing in their local area. Assist in helping local communities target specific areas for improving the health of children and families.
INDICATORS OF CHILD WELL-BEING Child poverty Childcare Assistance Divorce Free & Reduced Lunch High school Dropout Infant Mortality Lack of Maternal Education Low Birth Weight Babies Medicaid Nonmarital Births Parental Unemployment Single Parent Households SNAP TANF Teen Pregnancy Uninsured Children Youth Binge Drinking Youth Tobacco Use
WHY THESE 18? Based on current literature, and DCF input, on factors associated with child and family wellbeing outcomes. Measured at the state and county level on an annual basis. Measurement remains consistent each year. Interpretable rate allows for observation of change from year to year.
COUNTY SPOTLIGHTS
Bourbon 3% 1% 2% 1% Non-Hispanic White 2% Hispanic or Latino Black or African American American Indian/Alaska Native Asian/Hawaiian/Pacific Islander 91% Multiracial Bourbon Kansas Rank: 103/105 Z-Score: 0.90 2013 Population 14,826 2,895,801 2010 Persons per sq. mile 23.9 34.9 2009- 2013 Median household income $39,591 $51,332
Crawford 3% 2% 1%2% Non-Hispanic White 5% Hispanic or Latino Black or African American American Indian/Alaska Native Asian/Hawaiian/Pacific Islander Multiracial 87% Crawford Kansas Rank: 85/105 Z-Score: 0.47 2013 Population 39,330 2,895,801 2010 Persons per sq. mile 66.4 34.9 2009- 2013 Median household income $37,378 $51,332
Labette 2% 1% 4% Non-Hispanic White 5% 4% Hispanic or Latino Black or African American American Indian/Alaska Native Asian/Hawaiian/Pacific Islander Multiracial 84% Labette Kansas Rank: 102/105 Z-Score: 0.85 2013 Population 20,969 2,895,801 2010 Persons per sq. mile 33.5 34.9 2009- 2013 Median household income $40,916 $51,332
Montgomery 5% 1% 3% Non-Hispanic White 6% Hispanic or Latino 6% Black or African American American Indian/Alaska Native Asian/Hawaiian/Pacific Islander 79% Multiracial Montgomery Kansas Rank: 101/105 Z-Score: 0.82 2013 Population 34,396 2,895,801 2010 Persons per sq. mile 55.1 34.9 2009- 2013 Median household income $39,669 $51,332
Ranking by Indicator Bourbon Crawford Labette Montgomery 103 104 99 87 98 88 38 15 101 61 80 77 73 104 101 98 21 78 98 85 95 74 64 78 36 45 59 96 51 91 98 50 101 75 61 39 69 78 102 100 102 53 91 68 75 81 99 88 99 49 89 98 100 80 24 88 82 101 95 92 98 87 88 37 65 102 80 102 59 90 102 96 94 46 60 86 COMPOSITE RANK Child poverty Childcare Divorce Free & reduced lunch HS Dropout Infant Mortality Low birth weight babies Medicaid Mothers without a HS Diploma Nonmarital births Parental unemployment Single parent households SNAP TANF Teen pregnancy Uninsured children Youth binge drinking Youth tobacco use
Compared to each other 1 21 41 61 81 101 Stanton, 0.01 #57 Montgomery, 0.82 #101 Crawford, 0.47 #85 Labette, 0.85 #102 Bourbon, 0.90 #103
INTERPETING Z-SCORES When everything is measured with one unit, we can interpret what each score means in comparison to one another. 0 = average/mean Negative value = below the mean Positive value = above the mean Because our indicators are negative indicators of child and family wellbeing, higher/positive scores are worse. The likelihood of a value below -1 and above 1 is slight. Meaning if an indicator has a score of -1.32, they are doing very well, but a score of 1.32 means they are doing poorly. Good Bad
RANKINGS A high overall ranking does not mean that a given county ranks highly on each individual indicator. There are other indicators that could also serve as targets for intervention not included in this report (e.g., literacy, parenting skills, father involvement, skilled job training, money management) that could have an impact on child poverty locally. Need to be aware of trends in intervention target to determine whether the community intervention made a difference. Example: Teen Pregnancy Need for local evaluation of intervention targets.
CHILD POVERTY Based on the Child Poverty Report: Fact Sheet of Factors Associated with Child Poverty (Anderson et al., 2014)
Child Poverty CHILD POVERTY IS A SYSTEMIC SOCIETAL CANCER THAT THREATENS THE PRESENT AND FUTURE WELL- BEING OF CHILDREN. ALTHOUGH A MULTITUDE OF FACTORS PLAY A ROLE IN WHETHER CHILDREN WILL GROW UP IN POVERTY, EDUCATION, EMPLOYMENT, AND FAMILY STRUCTURE HAVE CONSISTENTLY BEEN LINKED TO SUBSEQUENT POVERTY
Education Education is a major protective factor against child poverty. When heads of households have at least a high school diploma, they earn nearly $22,000 more a year compared to those who dropped out of high school.2 The difference between earning a high school diploma and a bachelor s degree is even more remarkable as heads of households with a bachelor s degree earn nearly $55,000 more than those with a high school diploma.2
Education Nearly half of Kansas children in poverty have parents who do not have a high school diploma.3 Educated parents are likely to have more developed skills for the labor market, which result in higher levels of employment and higher earnings when employed.4 Improving education and enhancing opportunities for advanced training and education is a key variable in the fight against child poverty.
High School Dropout Mothers without a High School Diploma Education Doniphan Brown Washington Nemaha Marshall Cheyenne Rawlins Norton Smith Phillips Republic Decatur Jewell Atchison Jackson Cloud Clay Pottawatomie Riley Mitchell Leavenworth Wyandotte Osborne Sherman Sheridan Graham Rooks Thomas Jefferson Ottawa Shawnee Lincoln Geary Wabaunsee Johnson Douglas Logan Gove Ellis Wallace Trego Russell Dickinson Saline Ellsworth Osage Morris Franklin Miami Rush Lyon Greeley Wichita Ness Scott Barton Lane McPherson Rice Marion Anderson Chase Linn Coffey Pawnee Finney Hodgeman Kearny Harvey Woodson Bourbon Allen Reno Stafford Hamilton Greenwood Edwards Butler Gray Neosho Ford Pratt Crawford Sedgwick Wilson Kingman Stanton Haskell Grant Kiowa Elk Labette Cherokee Cowley Sumner Montgomery Barber Harper Comanche Clark Chautauqua Stevens Seward Morton Meade 1-25 51-75 101-105 76-100 26-50
Employment The unemployment rate is a strong and reliable predictor of child poverty; when states have increases in unemployment, child poverty rates tend to increase.5 66% of children who are living in poverty in Kansas have parents who are unemployed or underemployed (i.e., working part-time or part-year).6 A reduced demand for less-skilled workers, however, means that it is difficult for many poor parents to find long-term, full- time job opportunities.7
Employment Parents who are working but still poor are likely to be employed in jobs that exacerbate parental stress. Many of these parents have unstable and nonstandard work schedules; moreover, about 40% of low-income parents have no paid time off (sick days, medical leave, etc.).8 Increasing employment, therefore, is a key factor in reducing child poverty, but not all jobs are enough to lift families out of poverty.
Economic Factors Child Poverty Parental Unemployment Uninsured Children Doniphan Brown Washington Nemaha Marshall Cheyenne Rawlins Norton Smith Phillips Republic Decatur Jewell Atchison Jackson Cloud Clay Pottawatomie Riley Mitchell Leavenworth Wyandotte Osborne Sherman Sheridan Graham Rooks Thomas Jefferson Ottawa Shawnee Lincoln Geary Wabaunsee Johnson Douglas Logan Gove Ellis Wallace Trego Russell Dickinson Saline Ellsworth Osage Morris Franklin Miami Rush Lyon Greeley Wichita Ness Scott Barton Lane McPherson Rice Marion Anderson Chase Linn Coffey Pawnee Finney Hodgeman Kearny Harvey Woodson Bourbon Allen Reno Stafford Hamilton Greenwood Edwards Butler Gray Neosho Ford Pratt Crawford Sedgwick Wilson Kingman Stanton Haskell Grant Kiowa Elk Labette Cherokee Cowley Sumner Montgomery Barber Harper Comanche Clark Chautauqua Stevens Seward Morton Meade 1-25 51-75 101-105 76-100 26-50
Family Structure Children in married-couple families are far less likely to experience poverty than children in cohabiting or single parent homes; being raised in a married household reduces the risk of experiencing poverty by approximately 80%.9 Societal level changes, including high divorce rates, declining marriage rates, and continuously rising non- marital birth rates have increased the likelihood that children will live in poverty.10
Family Structure Divorce Nonmarital Births Single Parent Households Teen Pregnancy Doniphan Brown Washington Nemaha Marshall Cheyenne Rawlins Norton Smith Phillips Republic Decatur Jewell Atchison Jackson Cloud Clay Pottawatomie Riley Mitchell Leavenworth Wyandotte Osborne Sherman Sheridan Graham Rooks Thomas Jefferson Ottawa Shawnee Lincoln Geary Wabaunsee Johnson Douglas Logan Gove Ellis Wallace Trego Russell Dickinson Saline Ellsworth Osage Morris Franklin Miami Rush Lyon Greeley Wichita Ness Scott Barton Lane McPherson Rice Marion Anderson Chase Linn Coffey Pawnee Finney Hodgeman Kearny Harvey Woodson Bourbon Allen Reno Stafford Hamilton Greenwood Edwards Butler Gray Neosho Ford Pratt Crawford Sedgwick Wilson Kingman Stanton Haskell Grant Kiowa Elk Labette Cherokee Cowley Sumner Montgomery Barber Harper Comanche Clark Chautauqua Stevens Seward Morton Meade 1-25 51-75 101-105 76-100 26-50
Linking the Three Education, employment, and family structure are inextricably linked to each other. For example, graduating from high school is associated with more consistent employment later in life.11 The decline in work rates among males plays a role in marriage rates; that is, men with low work rates lack the economic stability that is conducive to family formation.12 Giving attention to the unique contribution of each factor, the interplay between factors, and taking into consideration racial and ethnic disparities within each factor may inform policies that can ultimately strengthen children s economic position.
OTHER DOMAINS
Childcare Free & Reduced Lunch Medicaid SNAP TANF Aid Programs Doniphan Brown Washington Nemaha Marshall Cheyenne Rawlins Norton Smith Phillips Republic Decatur Jewell Atchison Jackson Cloud Clay Pottawatomie Riley Mitchell Leavenworth Wyandotte Osborne Sherman Sheridan Graham Rooks Thomas Jefferson Ottawa Shawnee Lincoln Geary Wabaunsee Johnson Douglas Logan Gove Ellis Wallace Trego Russell Dickinson Saline Ellsworth Osage Morris Franklin Miami Rush Lyon Greeley Wichita Ness Scott Barton Lane McPherson Rice Marion Anderson Chase Linn Coffey Pawnee Finney Hodgeman Kearny Harvey Woodson Bourbon Allen Reno Stafford Hamilton Greenwood Edwards Butler Gray Neosho Ford Pratt Crawford Sedgwick Wilson Kingman Stanton Haskell Grant Kiowa Elk Labette Cherokee Cowley Sumner Montgomery Barber Harper Comanche Clark Chautauqua Stevens Seward Morton Meade 1-25 51-75 101-105 76-100 26-50
Infant Mortality Low Birth Weight Babies Youth Binge Drinking Youth Tobacco Use Health Doniphan Brown Washington Nemaha Marshall Cheyenne Rawlins Norton Smith Phillips Republic Decatur Jewell Atchison Jackson Cloud Clay Pottawatomie Riley Mitchell Leavenworth Wyandotte Osborne Sherman Sheridan Graham Rooks Thomas Jefferson Ottawa Shawnee Lincoln Geary Wabaunsee Johnson Douglas Logan Gove Ellis Wallace Trego Russell Dickinson Saline Ellsworth Osage Morris Franklin Miami Rush Lyon Greeley Wichita Ness Scott Barton Lane McPherson Rice Marion Anderson Chase Linn Coffey Pawnee Finney Hodgeman Kearny Harvey Woodson Bourbon Allen Reno Stafford Hamilton Greenwood Edwards Butler Gray Neosho Ford Pratt Crawford Sedgwick Wilson Kingman Stanton Haskell Grant Kiowa Elk Labette Cherokee Cowley Sumner Montgomery Barber Harper Comanche Clark Chautauqua Stevens Seward Morton Meade 1-25 51-75 101-105 76-100 26-50
CHILD POVERTY
Child Poverty 35.0 30.0 25.0 20.0 15.0 10.0 5.0 0.0 1980 2009 1970 1990 1995 1997 1998 1999 2000 2001 2002 2003 2004 2005 2006 2007 2008 2010 2011 2012 2013 Years Kansas Bourbon Crawford Labette Montgomery The estimated percent of children under the age of 18 living in families with incomes below 100% of the U.S. poverty threshold.
CHILDCARE ASSISTANCE
Child Care Assistance 1.40 1.20 1.00 0.80 0.60 0.40 0.20 0.00 2001 2002 2003 2004 2005 2006 2007 2008 2009 2010 2011 2012 2013 Years Kansas Bourbon Crawford Labette Montgomery The average number of individuals per month receiving Child Care benefits out of the total population.
Divorce 8 7 6 5 4 3 2 1 0 1998 2009 1970 1980 1990 1995 1996 1997 1999 2000 2001 2002 2003 2004 2005 2006 2007 2008 2010 2011 2012 2013 Years Kansas Bourbon Crawford Labette Montgomery The total number of divorces and annulments out of total population times 1000.
FREE & REDUCED LUNCH
Free & Reduced Lunch Program Enrollment 70 60 50 40 30 20 10 0 2003 2004 2005 2006 2007 2008 2009 2010 2011 2012 2013 Year Kansas Bourbon Crawford Labette Montgomery Enrollment represents school total headcount enrollment as of September 20th of each year
HIGH SCHOOL DROPOUT
High School Dropout 6 5 4 3 2 1 0 2011 1995 1996 1997 1998 1999 2000 2001 2002 2003 2004 2005 2006 2007 2008 2009 2010 2012 2013 Years Kansas Bourbon Crawford Labette Montgomery Yearly total dropouts divided by the total enrollment of grades 7- 12. Dropouts are not synonymous with not graduating. Year reported refers to year in which the school year began; for 2012, this refers to the 2012-2013 academic year.
INFANT MORTALITY
Infant Mortality 35.0 30.0 25.0 20.0 15.0 10.0 5.0 0.0 2010 1970 1980 1990 1995 1996 1997 1998 1999 2000 2001 2002 2003 2004 2005 2006 2007 2008 2009 2011 2012 2013 Years Kansas Bourbon Crawford Labette Montgomery The death of a live-born infant that occurs within the first year of life. Rate is calculated by the number of infant deaths divided by the number of live births times 1000.
LOW BIRTH WEIGHT BABIES
Low Birthweight Babies 14.0 12.0 10.0 8.0 6.0 4.0 2.0 0.0 1990 1995 1996 1997 1998 1999 2000 2001 2002 2003 2004 2005 2006 2007 2008 2009 2010 2011 2012 2013 Years Kansas Bourbon Crawford Labette Montgomery The percentage of live births weighing less than 5.5 pounds out of total live births.
MEDICAID ENROLLMENT
Medicaid Enrollment 30.0 25.0 20.0 15.0 10.0 5.0 0.0 2001 2002 2003 2004 2005 2006 2007 2008 2009 2010 2011 2012 2013 Years Kansas Bourbon Crawford Labette Montgomery The unique (unduplicated) number of individuals that received Medicaid benefits out of the total population.
MOTHERS WITHOUT A HIGH SCHOOL DIPLOMA
Mothers without a High school diploma 30 25 20 15 10 5 0 1999 2007 1990 1995 1996 1997 1998 2000 2001 2002 2003 2004 2005 2006 2008 2009 2010 2011 2012 Years Kansas Bourbon Crawford Labette Montgomery The percentage of live births to mothers who have not received a high school degree, as indicated on the child s birth certificate out of total live births.