Analysis on Chinese Carbon Anode Supply-Demand and Export Market

 undefined


C
o
n
t
e
n
t
s
A
n
a
l
y
s
i
s
o
n
C
h
i
n
e
s
e
a
n
o
d
e
s
u
p
p
l
y
-
d
e
m
a
n
d
r
e
l
a
t
i
o
n
s
h
i
p
i
n
2
0
1
8
A
n
a
l
y
s
i
s
o
n
a
n
o
d
e
e
x
p
o
r
t
d
a
t
a
f
r
o
m
2
0
1
5
t
o
2
0
1
7
A
n
a
l
y
s
i
s
o
n
a
n
o
d
e
e
x
p
o
r
t
m
a
r
k
e
t
P
r
e
d
i
c
t
i
o
n
o
f
a
n
o
d
e
e
x
p
o
r
t
m
a
r
k
e
t
f
r
o
m
2
0
1
8
t
o
2
0
1
9
1
2
3
4
A
n
a
l
y
s
i
s
o
n
C
h
i
n
e
s
e
a
n
o
d
e
s
u
p
p
l
y
-
d
e
m
a
n
d
r
e
l
a
t
i
o
n
s
h
i
p
i
n
2
0
1
8
1
1
3
4
Ⅰ Analysis on Chinese anode supply-demand relationship in 2018
1
.
A
n
o
d
e
o
u
t
p
u
t
a
n
d
c
o
n
s
u
m
p
t
i
o
n
d
a
t
a
f
r
o
m
J
a
n
2
0
1
6
t
o
M
a
r
2
0
1
8
(
1
0
,
0
0
0
t
)
Ⅰ Analysis on Chinese anode supply-demand relationship in 2018
1
.
A
n
o
d
e
o
u
t
p
u
t
a
n
d
c
o
n
s
u
m
p
t
i
o
n
d
a
t
a
f
r
o
m
J
a
n
2
0
1
6
t
o
M
a
r
2
0
1
8
(
1
0
,
0
0
0
t
)
O
v
e
r
a
l
l
a
n
o
d
e
c
a
p
a
c
i
t
y
Ⅰ Analysis on Chinese anode supply-demand relationship in 2018
2
.
A
n
o
d
e
c
a
p
a
c
i
t
y
(
n
e
w
l
y
-
a
d
d
e
d
c
a
p
a
c
i
t
y
i
n
c
l
u
d
e
d
)
a
n
d
m
a
r
k
e
t
d
e
m
a
n
d
i
n
2
0
1
8
S
t
a
t
i
s
t
i
c
s
o
n
s
o
o
n
-
t
o
-
o
p
e
r
a
t
e
c
a
p
a
c
i
t
y
o
f
C
h
i
n
e
s
e
c
a
r
b
o
n
c
o
m
p
a
n
i
e
s
Ⅰ Analysis on Chinese anode supply-demand relationship in 2018
2
.
A
n
o
d
e
c
a
p
a
c
i
t
y
(
n
e
w
l
y
-
a
d
d
e
d
c
a
p
a
c
i
t
y
i
n
c
l
u
d
e
d
)
a
n
d
m
a
r
k
e
t
d
e
m
a
n
d
C
h
i
n
e
s
e
p
r
e
b
a
k
e
d
a
n
o
d
e
p
r
o
d
u
c
e
r
s
’
n
e
w
p
r
o
j
e
c
t
s
i
n
2
0
1
8
Ⅰ Analysis on Chinese anode supply-demand relationship in 2018
3
.
S
t
a
t
i
s
t
i
c
s
o
n
s
o
o
n
-
t
o
-
o
p
e
r
a
t
e
c
a
p
a
c
i
t
y
o
f
C
h
i
n
e
s
e
p
r
i
m
a
r
y
a
l
u
m
i
n
u
m
c
o
m
p
a
n
i
e
s
Ⅰ Analysis on Chinese anode supply-demand relationship in 2018
4
.
T
r
a
n
s
f
e
r
f
r
o
m
s
e
l
l
e
r
’
s
m
a
r
k
e
t
t
o
b
u
y
e
r
’
s
m
a
r
k
e
t
Anode price trend
Ⅰ Analysis on Chinese anode supply-demand relationship in 2018
5
.
C
h
a
n
g
e
s
o
f
i
n
t
e
r
n
a
t
i
o
n
a
l
p
o
l
i
t
i
c
a
l
e
n
v
i
r
o
n
m
e
n
t
’
s
i
n
f
l
u
e
n
c
e
s
o
n
p
r
i
m
a
r
y
a
l
u
m
i
n
u
m
a
n
d
a
n
o
d
e
m
a
r
k
e
t
s
A
n
a
l
y
s
i
s
o
n
a
n
o
d
e
e
x
p
o
r
t
d
a
t
a
f
r
o
m
2
0
1
5
t
o
2
0
1
7
1
2
3
4
Ⅱ
A
n
a
l
y
s
i
s
o
n
a
n
o
d
e
e
x
p
o
r
t
d
a
t
a
f
r
o
m
2
0
1
5
t
o
2
0
1
7
1
.
E
x
p
o
r
t
s
t
a
t
i
s
t
i
c
s
S
t
a
t
i
s
t
i
c
s
o
n
t
o
t
a
l
a
n
o
d
e
e
x
p
o
r
t
f
r
o
m
2
0
1
5
t
o
2
0
1
7
(
t
o
n
)
Ⅱ
A
n
a
l
y
s
i
s
o
n
a
n
o
d
e
e
x
p
o
r
t
d
a
t
a
f
r
o
m
2
0
1
5
t
o
2
0
1
7
2
.
E
x
p
o
r
t
c
o
m
p
a
n
y
(
t
h
e
n
u
m
b
e
r
o
f
s
u
c
h
c
o
m
p
a
n
i
e
s
b
e
c
o
m
i
n
g
m
o
r
e
c
o
n
c
e
n
t
r
a
t
e
d
f
r
o
m
n
e
a
r
l
y
m
o
r
e
t
h
a
n
t
e
n
t
o
4
-
5
)
T
o
t
a
l
e
x
p
o
r
t
v
o
l
u
m
e
f
o
r
a
n
o
d
e
b
y
m
a
j
o
r
c
o
m
p
a
n
y
f
r
o
m
2
0
1
5
t
o
2
0
1
7
(
t
o
n
)
Ⅱ
A
n
a
l
y
s
i
s
o
n
a
n
o
d
e
e
x
p
o
r
t
d
a
t
a
f
r
o
m
2
0
1
5
t
o
2
0
1
7
2. Export company (the number of such companies becoming more concentrated
from nearly more than ten to 4-5)
T
o
t
a
l
e
x
p
o
r
t
v
o
l
u
m
e
f
o
r
a
n
o
d
e
b
y
m
a
j
o
r
c
o
m
p
a
n
y
f
r
o
m
2
0
1
5
t
o
2
0
1
7
(
t
o
n
)
Ⅱ
A
n
a
l
y
s
i
s
o
n
a
n
o
d
e
e
x
p
o
r
t
d
a
t
a
f
r
o
m
2
0
1
5
t
o
2
0
1
7
3
.
I
m
p
o
r
t
c
o
u
n
t
r
y
a
n
d
i
m
p
o
r
t
q
u
a
n
t
i
t
y
T
o
t
a
l
e
x
p
o
r
t
v
o
l
u
m
e
f
o
r
a
n
o
d
e
b
y
m
a
j
o
r
c
o
u
n
t
r
y
f
r
o
m
2
0
1
5
t
o
2
0
1
7
(
t
o
n
)
Ⅱ
A
n
a
l
y
s
i
s
o
n
a
n
o
d
e
e
x
p
o
r
t
d
a
t
a
f
r
o
m
2
0
1
5
t
o
2
0
1
7
3
.
I
m
p
o
r
t
c
o
u
n
t
r
y
a
n
d
i
m
p
o
r
t
q
u
a
n
t
i
t
y
T
o
t
a
l
e
x
p
o
r
t
v
o
l
u
m
e
f
o
r
a
n
o
d
e
b
y
m
a
j
o
r
c
o
u
n
t
r
y
f
r
o
m
2
0
1
5
t
o
2
0
1
7
(
t
o
n
)
A
n
a
l
y
s
i
s
o
n
a
n
o
d
e
e
x
p
o
r
t
m
a
r
k
e
t
1
3
4
E
f
f
e
c
t
o
n
a
n
o
d
e
e
x
p
o
r
t
m
a
r
k
e
t
r
e
s
u
l
t
e
d
f
r
o
m
c
h
a
n
g
e
s
i
n
d
o
m
e
s
t
i
c
m
a
r
k
e
t
1. Impact of the heating season: Most of China's major anode production areas are
located in "2+26" cities. According to 2017-2018 policy's requirements for the
heating season, enterprises meeting standards should reduce output by half,
while small-sized production companies that could not meet the standards were
shut down, leading to tight anode supply and decline of anode exports.
Ⅲ Analysis on anode export market
2
.
I
m
p
a
c
t
o
f
p
r
i
c
e
:
A
c
c
o
r
d
i
n
g
t
o
t
h
e
r
e
q
u
i
r
e
m
e
n
t
s
o
f
e
n
v
i
r
o
n
m
e
n
t
a
l
i
n
s
p
e
c
t
i
o
n
s
,
a
l
l
m
a
j
o
r
a
n
o
d
e
p
r
o
d
u
c
e
r
s
c
o
n
d
u
c
t
e
d
o
f
f
-
p
e
a
k
p
r
o
d
u
c
t
i
o
n
a
n
d
p
r
i
m
a
r
y
a
l
u
m
i
n
u
m
c
o
m
p
a
n
i
e
s
b
u
i
l
t
s
t
o
c
k
s
i
n
s
u
c
c
e
s
s
i
o
n
,
l
e
a
d
i
n
g
t
o
c
o
n
t
i
n
u
o
u
s
i
n
c
r
e
a
s
e
i
n
a
n
o
d
e
p
r
i
c
e
s
i
n
d
o
m
e
s
t
i
c
m
a
r
k
e
t
,
s
o
a
n
o
d
e
p
r
o
d
u
c
e
r
s
g
a
i
n
e
d
h
i
g
h
p
r
o
f
i
t
s
n
e
a
r
l
y
w
i
t
h
o
u
t
D
/
A
p
a
y
m
e
n
t
t
e
r
m
.
T
h
e
a
n
o
d
e
e
x
p
o
r
t
w
a
s
m
o
s
t
l
y
b
a
s
e
d
o
n
a
p
r
i
c
e
f
o
r
m
u
l
a
o
r
o
n
e
p
r
i
c
e
f
o
r
o
n
e
o
r
d
e
r
,
s
o
p
r
o
f
i
t
s
f
o
r
a
n
o
d
e
e
x
p
o
r
t
w
e
r
e
l
o
w
e
r
t
h
a
n
t
h
o
s
e
f
o
r
d
o
m
e
s
t
i
c
s
a
l
e
s
,
w
h
i
c
h
h
a
d
s
o
m
e
n
e
g
a
t
i
v
e
e
f
f
e
c
t
s
o
n
t
h
e
a
n
o
d
e
e
x
p
o
r
t
.
3.
Impact of the indicators: The technical requirements for exported
anodes are much higher than those of domestic anodes. In order to
ensure the balance of physical and chemical indicators, it is
necessary to purchase high-quality pet coke with low sulfur and low
vanadium, resulting in exporters' continuous high-level costs. Some
companies reduced anode exports and supplied the material in the
domestic market in order to seek profits.
Ⅲ Analysis on anode export market
4.
The influence of international political environment: The changes in
the international political environment resulted from the game
between great powers can bring about tremendous changes in the
trend of bulk commodities.
4
P
r
e
d
i
c
t
i
o
n
o
f
a
n
o
d
e
e
x
p
o
r
t
m
a
r
k
e
t
f
r
o
m
2
0
1
8
t
o
2
0
1
9
1
3
1. The exports
of
anode in 2018-2019 should be basically the
same as those in 2017 according to customs statistics, but
actually the exports would decline sharply. The exports of
commercial anode would be about 860,000
-
900,000t in 2018,
and would decline further to below 800,000t in 2019.
Ⅳ Prediction of anode export market from 2018 to
2019
2
.
T
h
e
e
x
p
o
r
t
p
r
i
c
e
s
f
o
r
a
n
o
d
e
w
i
l
l
b
e
c
o
m
e
m
o
r
e
a
n
d
m
o
r
e
c
l
o
s
e
t
o
t
h
o
s
e
i
n
t
h
e
d
o
m
e
s
t
i
c
m
a
r
k
e
t
,
b
u
t
t
h
e
c
h
a
n
g
e
s
i
n
e
x
p
o
r
t
p
r
i
c
e
s
a
r
e
i
n
s
e
p
a
r
a
b
l
e
w
i
t
h
p
r
i
c
e
s
f
o
r
r
a
w
m
a
t
e
r
i
a
l
o
f
a
n
o
d
e
s
u
p
p
l
i
e
d
t
o
f
o
r
e
i
g
n
c
u
s
t
o
m
e
r
s
!
3. The quality of anode, the reasonableness of prices, the brand
and culture of enterprises determine the companies' market
share in anode export.
Ⅳ Prediction of anode export market from 2018 to
2019
4. Relative solidification of anode export market results in limited
new suppliers.
5. Future trends of anode export: improving anode quality,
reducing anode consumption and assisting primary aluminum
companies in producing high-end refined aluminum.
This analysis delves into the supply-demand dynamics of Chinese carbon anodes in 2018, examining output, consumption, capacity, market demand, and new projects. Insights are provided on the export data from 2015 to 2017 and predictions for the export market from 2018 to 2019.

Download Presentation

Please find below an Image/Link to download the presentation.
The content on the website is provided AS IS for your information and personal use only. It may not be sold, licensed, or shared on other websites without obtaining consent from the author. Download presentation by click this link. If you encounter any issues during the download, it is possible that the publisher has removed the file from their server.
E N D
Presentation Transcript
Jining Carbon Group Co., Ltd. Men Yong 2018.05.18
Analysis on Chinese carbon anode supply- demand and the export market
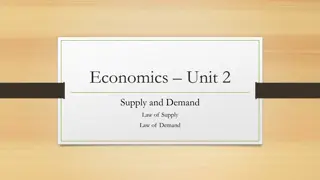
Contents 1 Analysis on Chinese anode supply-demand relationship in 2018 2 Analysis on anode export data from 2015 to 2017 3 Analysis on anode export market 4 Prediction of anode export market from 2018 to 2019
1 1 Analysis on Chinese anode supply-demand relationship in 2018 3 4
Analysis on Chinese anode supply-demand relationship in 2018 1. Anode output and consumption data from Jan 2016 to Mar 2018 (10,000t) 170 160 150 140 Anode consumption 130 Anode output 120 110 100
Analysis on Chinese anode supply-demand relationship in 2018 1. Anode output and consumption data from Jan 2016 to Mar 2018 (10,000t) Overall anode capacity 2700 2600 2500 2400 2300 2200 2100 2000
Analysis on Chinese anode supply-demand relationship in 2018 2. Anode capacity (newly-added capacity included) and market demand in 2018 Statistics on soon-to-operate capacity of Chinese carbon companies Company Built capacity (10,000t) Newly-added capacity (10,000t) Shandong Xinfa 60 60 Gansu Hualu 0 15 Liaoning Zhongwang 25 25 Qingzhou Tailong Carbon and Chemical Shandong Yinwang Carbon Xinjiang Qiya 12 12 0 10 30 15 Dong'e Hefeng 15 15 Shaanxi Meixin 0 30 Shanxi Huasheng 6 4 Total 148 186
Analysis on Chinese anode supply-demand relationship in 2018 2. Anode capacity (newly-added capacity included) and market demand Chinese prebaked anode producers new projects in 2018 Built capacity (10,000t) Newly-added capacity (10,000t) 60 Expected date for starting operation June Company Shandong Innovation Carbon Material Guangxi Qiangqiang Carbon 0 70 20 Late September September Sunstone Qili Carbon Material 0 30 Tianlin Baise Mining Tiantian Carbon Shandong Zhengxin New Material Xinjiang Tianshan 0 40 September 0 30 September 30 30 October Shanxi Huaze 22 28 October Chibi Changcheng 12 12 November Total 134 250
Analysis on Chinese anode supply-demand relationship in 2018 3. Statistics on soon-to-operate capacity of Chinese primary aluminum companies Expected newly- added capacity in 2018 (10,000t) Province Company Current running capacity (10,000t) Operation date Guangxi Laibin Yinhai Aluminum Co., Ltd. Guangxi Baise Mining Aluminum Co., Ltd. Guangxi Suyuan Aluminum Co., Ltd. Guangxi Hualei New Material Co., Ltd. Guangxi Xinfa Aluminum & Electricity Co., Ltd. Inner Mongolia Huayun New Material Co., Ltd. Inner Mongolia Mengtai Coal & Electricity Co., Ltd. Inner Mongolia Chuangyuan Metal Co., Ltd. East Hope Guyang Plant Guizhou Anshun Huangguoshu Aluminum Co., Ltd. Mid-March 2018 Early April 2018 June 2018 42 17 38 50 8 12 Guangxi 25 20 March 2018 32 10 March 2018 65 18 Undetermined Inner Mongolia 10 50 January 2018 7 38 January 2018 0 40 June 2018 10 3 April 2019 2018 (accurate date undetermined) Guizhou Yuping Guangmao Aluminum Co., Ltd. 0 10 Guizhou Guizhou Xingren Denggao Aluminum Co., Ltd. Guizhou Xingren Denggao New Material Co., Ltd. Guizhou Huaren New Material Co., Ltd. 0 30 Undetermined 0 0 Undetermined Mid-March 2018 37.5 18
Expected newly-added capacity in 2018 (10,000t) Current running capacity (10,000t) Operation date Province Company Yunnan Aluminum Zhaotong Plant August 2018 (provisional) October 2018 (provisional) Undetermine d 0 35 Yunnan Dali Heqing Plant 0 21 Liaoning Zhongwang Group Gansu Zhongrui Aluminum Co., Ltd. (phase one) Liaoning 43 46 0 8 9 Apr 2018 Gansu November 2018 (provisional) Undetermine d Gansu Zhongrui Aluminum Co., Ltd. (phase two) 0 40 CHALCO Shanxi Huarun Co., Ltd. Shaanxi Meixin Industry Investment Co., Ltd. SPIC Ningxia Energy Aluminum Co., Ltd. Xinjiang East Hope Nonferrous Metal Co., Ltd. Xinjiang Qiya Aluminum & Power Co., Ltd. Total Shanxi 0 50 Shaanxi 0 30 May Ningxia 99 6 January 2018 Undetermine d Undetermine d 80 3 Xinjiang 80 35 577 590
Analysis on Chinese anode supply-demand relationship in 2018 4. Transfer from seller s market to buyer s market Anode price trend Anode price trend
Analysis on Chinese anode supply-demand relationship in 2018 5. Changes of international political environment s influences on primary aluminum and anode markets
1 2 Analysis on anode export data from 2015 to 2017 3 4
Analysis on anode export data from 2015 to 2017 1. Export statistics Statistics on total anode export from 2015 to 2017 (ton) 2015 2015 2016 2016 2017 2017 1,071,263 1,071,263 1,083,106 1,083,106 1,028,807 1,028,807
Analysis on anode export data from 2015 to 2017 2. Export company (the number of such companies becoming more concentrated from nearly more than ten to 4-5) Total export volume for anode by major company from 2015 to 2017 (ton) MC Jinan Aohai Carbon Products Baise Haohai Carbon Dezhou Oulai Yongxing Carbon 71,616 Zhejiang Anode Solutions Jinan Wanfang Carbon Sunstone Year Chenyang Carbon 2015 129,194 38,730 139,568 134,679 142,025 283,509 2016 52,820 32,875 76,180 156,495 128,308 210,059 354,296 2017 45,112 32,266 101,222 139,145 116,179 173,239 315,447
Analysis on anode export data from 2015 to 2017 2. Export company (the number of such companies becoming more concentrated 2. Export company (the number of such companies becoming more concentrated from nearly more than ten to 4 from nearly more than ten to 4- -5) 5) 400,000 Baise Haohai Carbon Co., td. Dezhou Oulai Yongxing Carbon Co., Ltd. MC Zhejiang Anode Solutions Co., Ltd. Jinan Aohai Carbon Products Co., Ltd. Jinan Wanfang Carbon Co., Ltd. Shandong Chenyang Carbon Co., Ltd. 350,000 300,000 250,000 200,000 150,000 100,000 50,000 0 2015 Total export volume for anode by major company from 2015 to 2017 (ton) 2016 2017
Analysis on anode export data from 2015 to 2017 3. Import country and import quantity Total export volume for anode by major country from 2015 to 2017 (ton) Year Malaysia Iceland Sweden Canada Total Russia UAE 2015 171,315 195,620 107,572 87,050 67,225 155,090 1,071,26 3 2016 162,949 390,134 50,241 21,823 61,381 186,116 1,083,10 6 2017 166,555 349,197 3,885 26,067 75,640 195,005 1,028,80 7
Analysis on anode export data from 2015 to 2017 3. Import country and import quantity 450,000 400,000 350,000 Russia Malaysia UAE Iceland Sweden Canada 300,000 250,000 200,000 150,000 100,000 50,000 0 2015 2016 2017 Total export volume for anode by major country from 2015 to 2017 (ton)
1 3 Analysis on anode export market 4
Analysis on anode export market Effect on anode export market resulted from changes in domestic market 1. Impact of the heating season: Most of China's major anode production areas are located in "2+26" cities. According to 2017-2018 policy's requirements for the heating season, enterprises meeting standards should reduce output by half, while small-sized production companies that could not meet the standards were shut down, leading to tight anode supply and decline of anode exports. 2. Impact of price: According to the requirements of environmental inspections, all major anode producers conducted off-peak production and primary aluminum companies built stocks in succession, leading to continuous increase in anode prices in domestic market, so anode producers gained high profits nearly without D/A payment term. The anode export was mostly based on a price formula or one price for one order, so profits for anode export were lower than those for domestic sales, which had some negative effects on the anode export.
Analysis on anode export market 3. Impact of the indicators: The technical requirements for exported anodes are much higher than those of domestic anodes. In order to ensure the balance of physical and chemical indicators, it is necessary to purchase high-quality pet coke with low sulfur and low vanadium, resulting in exporters' continuous high-level costs. Some companies reduced anode exports and supplied the material in the domestic market in order to seek profits. 4. The influence of international political environment: The changes in the international political environment resulted from the game between great powers can bring about tremendous changes in the trend of bulk commodities.
1 4 Prediction of anode export market from 2018 to 2019 3
Prediction of anode export market from 2018 to 2019 1. The exports of anode in 2018-2019 should be basically the same as those in 2017 according to customs statistics, but actually the exports would decline sharply. The exports of commercial anode would be about 860,000-900,000t in 2018, and would decline further to below 800,000t in 2019. 2. The export prices for anode will become more and more close to those in the domestic market, but the changes in export prices are inseparable with prices for raw material of anode supplied to foreign customers!
Prediction of anode export market from 2018 to 2019 3. The quality of anode, the reasonableness of prices, the brand and culture of enterprises determine the companies' market share in anode export. 4. Relative solidification of anode export market results in limited new suppliers. 5. Future trends of anode export: improving anode quality, reducing anode consumption and assisting primary aluminum companies in producing high-end refined aluminum.