Exploring Sanitation Priorities and Investments: Insights from UBSUP Preparatory Study
The presentation discusses sanitation issues and priorities based on a survey of 2,088 households in 11 cities and towns. It highlights problems related to sanitation, residents' opinions on the need for improvement, types of toilets used, and investment plans in sanitation infrastructure.

Download Presentation

Please find below an Image/Link to download the presentation.
The content on the website is provided AS IS for your information and personal use only. It may not be sold, licensed, or shared on other websites without obtaining consent from the author. Download presentation by click this link. If you encounter any issues during the download, it is possible that the publisher has removed the file from their server.
E N D
Presentation Transcript
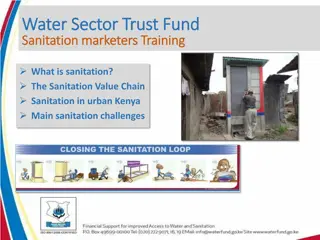
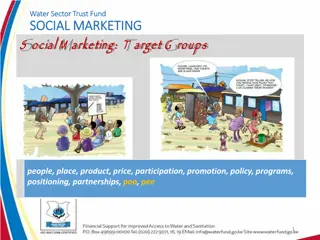
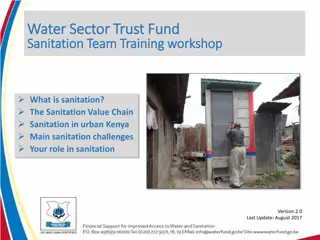
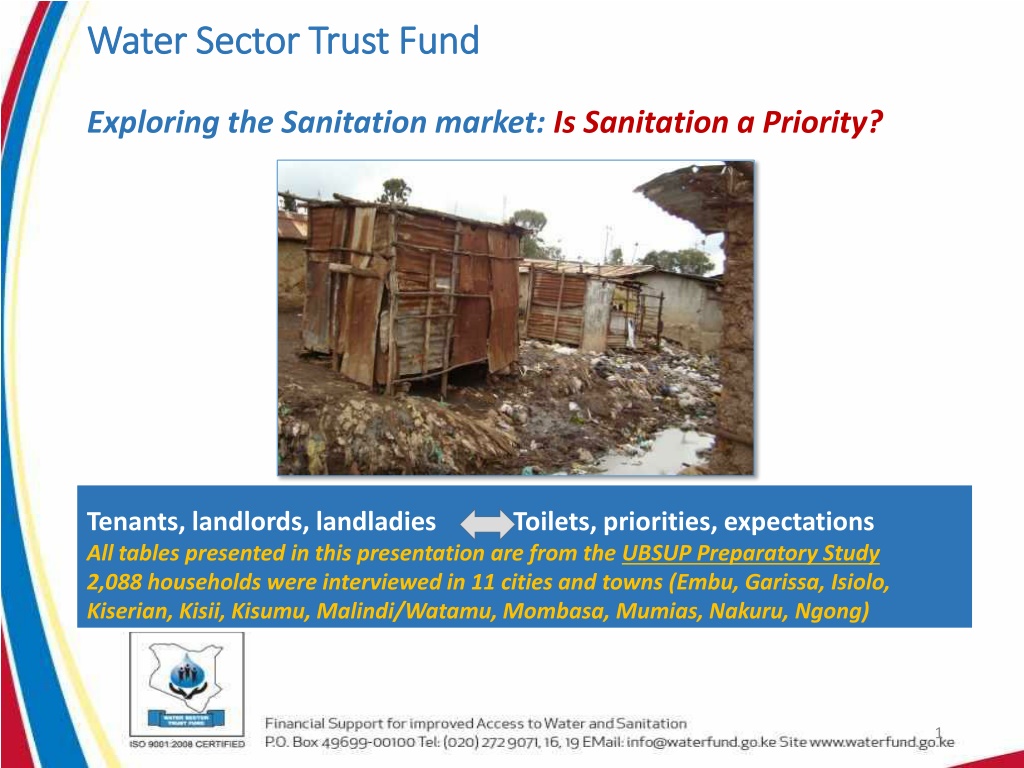
Water Sector Trust Fund Water Sector Trust Fund Exploring the Sanitation market: Is Sanitation a Priority? Tenants, landlords, landladies Toilets, priorities, expectations All tables presented in this presentation are from the UBSUP Preparatory Study 2,088 households were interviewed in 11 cities and towns (Embu, Garissa, Isiolo, Kiserian, Kisii, Kisumu, Malindi/Watamu, Mombasa, Mumias, Nakuru, Ngong) 1
Main problems related to sanitation Main problems related to sanitation Household members face a wide variety of sanitation problems Below are the main problem categories and percentages Responses Main sanitation problem Frequency Percent There are no toilets Toilets are not sufficient Toilets are dirty Toilets are dangerous (poor technical condition) Toilet pits are full Not well maintained Toilet smells Toilet overflows No hand-washing facility High water table Sandy soils and collapsing pits Flies and/or termites Sharing No problem 69 441 257 272 110 244 369 102 53 130 122 53 208 82 2,5 15,9 9,3 9,8 4,0 8,8 13,3 3,7 1,9 4,7 4,4 1,9 7,5 3,0 2
Need to improve sanitation? Need to improve sanitation? A large majority of landlords, tenants and house owners (plots occupied by a single household) think that their sanitation situation needs improving Type of resident The toilet needs improving (Yes) (%) Tenant 77.1 Landlord 74.0 Free lodging resident 78.6 House owner 72.6 Other 79.5 Average: 76.0 3
UBSUP Sanitation Marketing: UBSUP Sanitation Marketing: Concept development Concept development Approximately 86% of all households using a traditional pit latrine think this toilet facility needs to be improved Type of toilet used by household Toilet needs improving (Yes) (%) Used by (%) Traditional pit latrine 86.2 53 Improved pit latrine 69.1 23 Ventilated improved pit latrine (VIP) 68.5 6 Pour flush toilet 57.3 12 Toilet linked to a septic tank 54.5 6 Toilet linked to the sewer 87.5 Total: 76.0 100 4
Investing in Sanitation Investing in Sanitation When discussing investment in sanitation, a majority of households that do have investment plans intend to rehabilitate their existing toilet Sanitation investment plans Frequency Percent Ensure toilet remains clean 15 6,7 Rehabilitate existing toilet 126 56,0 Build new toilet 77 34,2 Don't know 2 ,9 Other 3 1,3 Non applicable 2 ,9 Total 225 100,0 5
Type of toilet households intend to construct Type of toilet households intend to construct Respondents were asked if they had plans to construct a new toilet . and if they had such plans they were asked which type of toilet they intend to construct Type of toilet household intent to construct Frequency Percent Flush toilet Traditional pit latrine Improved pit latrine Ventilated improved pit latrine Septic tank/soakaway Don't know yet Other Total Missing Total 9 7,7 24,8 30,8 12,8 3,4 9,4 6,0 94,9 5,1 100,0 29 36 15 4 11 7 111 6 117 6
What do tenants think of their landlords and What do tenants think of their landlords and landladies? landladies? Are landlords/-ladies able & willing to invest in better sanitation Frequency Percent (Only the views of tenants are considered) Able and willing 234 32,3 Able but not willing 280 38,6 Willing but not able 149 20,6 Not able and not willing 33 4,6 Other 15 2,1 Non applicable 14 1,9 Total 725 100,0 7
Building new toilets Building new toilets Expected problems Expected problems Toilets have to be constructed or assembled It is, therefore, important to know what problems one can expect during the construction/assembly phase Responses Percent of cases Technical problems during construction Frequency Percent 17,7 23,4 23,9 10,8 Percent 20,4 27,0 27,5 12,5 Rocky soils Sandy soils High water table Space for the toilet Space to work No problem Other Total 227 301 307 139 64 177 70 5,0 13,8 5,4 5,7 15,9 6,3 115,2 1.285 100,0 8
Is sanitation a household priority? Is sanitation a household priority? Household priorities Frequency Percent Having a TV 17 1,5 Safe water 324 28,6 Access to a good school 102 9,0 Improved sanitation 586 51,7 Access to a clinic or hospital 91 8,0 Don't know/No opinion 14 1,2 Total 1.134 100,0 9
Preferred toilets Preferred toilets Preferred toilet or practice: Frequency Percent Traditional pit latrine 38 3,4 Toilet bag ("PeePoo") 5 ,4 Improved pit latrine 165 14,6 Ventilated improved pit latrine 237 20,9 Pour flush toilet 163 14,4 Urine diversion toilet Flush toilet Biogas latrine 2 ,2 507 44,7 2 ,2 Composting toilet 1 ,1 Other 14 1,2 Total 1.134 100,0 10
What do people expect from their (new) toilet? What do people expect from their (new) toilet? Households were asked why they prefer a specific type of toilet Responses Why toilet type is preferred?(*) Percent of Cases Frequency Percent 10,0% 18,9% 1,5% 8,6% 1,7% 14,5% 13,3% 7,0% 1,2% 2,4% 1,0% 1,8% 5,3% 9,7% Modern/good/stylish Easy to clean Affordable No smell No flies User friendly Easy to maintain Durable Does not get full quickly Safe Can be used as a bathroom It's common Comfortable Cleanliness/hygiene Respondents were allowed to give more than one answer! (% > 100) 241 454 36 206 40 348 319 169 29 57 25 43 128 234 21,3% 40,1% 3,2% 18,2% 3,5% 30,7% 28,2% 14,9% 2,6% 5,0% 2,2% 3,8% 11,3% 20,7% 11
Thank You! Thank You! 12


 toilet?")