Performance Indicators for Centralized Public Procurement
The presentation by Gian Luigi Albano, Ph.D., outlines performance indicators for centralized public procurement, including economic effects of demand aggregation, value for money, inclusion of SMEs, market dynamics, and transaction costs. It also discusses relevant performance indicators such as savings, degree of success, and concentration indexes. The methodology for estimating savings by the Italian Institute of Statistics is detailed, involving deriving prices of comparable products/services and estimating realized savings from purchasing through centralized contracts.

Download Presentation

Please find below an Image/Link to download the presentation.
The content on the website is provided AS IS for your information and personal use only. It may not be sold, licensed, or shared on other websites without obtaining consent from the author. Download presentation by click this link. If you encounter any issues during the download, it is possible that the publisher has removed the file from their server.
E N D
Presentation Transcript
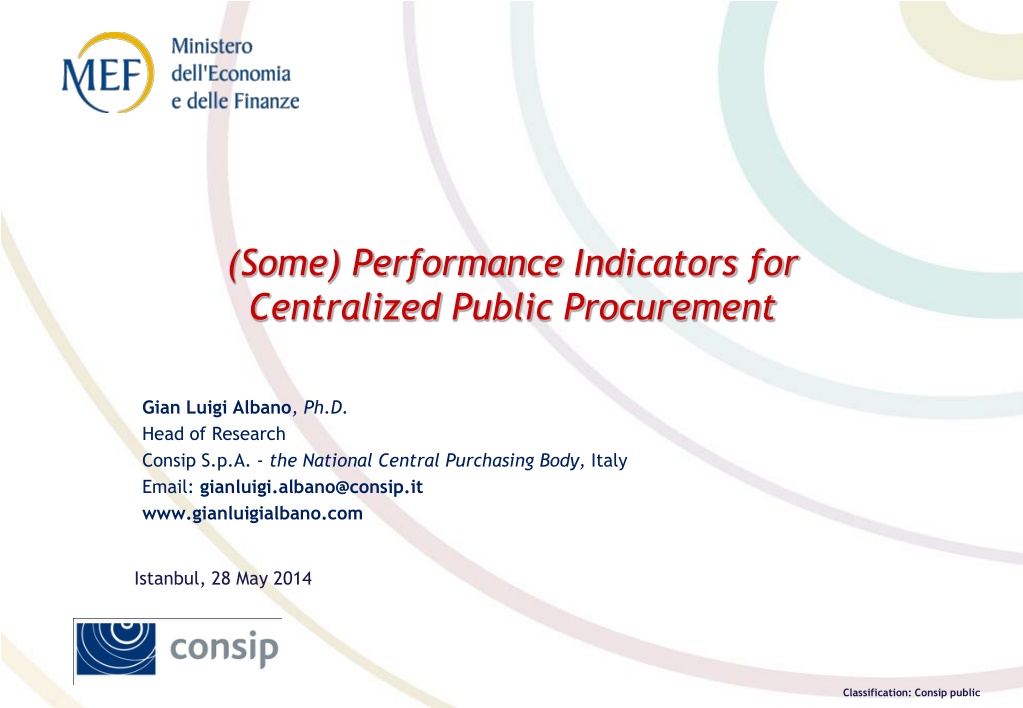
(Some) Performance Indicators for Centralized Public Procurement Gian Luigi Albano, Ph.D. Head of Research Consip S.p.A. - the National Central Purchasing Body, Italy Email: gianluigi.albano@consip.it www.gianluigialbano.com Istanbul, 28 May 2014 Classification: Consip public
Roadmap (Some of ) The economic effects of demand aggregation Value for money (through different channels) Inclusion of SMEs Market dynamics Transaction costs 2 Classification: Consip public
(Some) Relevant performance indicators Perfomance indicator(s) Economic dimension Value for money Savings Degree of success Inclusion of SMEs Concentration/ entry-exit indexes Market dynamics 3 Classification: Consip public
Measuring savings Two main problems : Reference price(s) Heterogeneity 4 Classification: Consip public
The savings estimation methodology by the Italian Institute of Statistics (ISTAT) (1/2) Step 1. Derive prices of comparable products/services purchased through and outside of Consip frame contracts (FCs) Comparable prices are derived by using a 3-step procedure: 1) Public bodies are asked to provide the prices of a given set of products purchased through and/or outside of Consip FCs (pconsip and pno-consip respectively); 2) The monetary value of products features which are specific to purchases made either through or outside of Consip FCs ( consip and no-consip) is evaluated; 3) The reported purchasing prices are cleaned of the value of product features which are specific to Consip or non-Consip purchasing contracts, that is: consip = pconsip consip and no-consip = pconsip no-consip consip & no-consip are prices of comparable products purchased through and outside of Consip s FCs respectively 5 Classification: Consip public
The savings estimation methodology by the Italian Institute of Statistics (ISTAT) (2/2) Step 2. Estimate the value of realized savings from purchasing through Consip s FCs Savings are obtained as the percentage difference between the prices of comparable products purchased under and outside Consip contracts, that is, by computing 1- consip / no-consip 6 Classification: Consip public
The Methodology in a simple picture Results Distributing the Survey to collect information on the level and composition of public expenditure on a defined set of products Non-response bias Relevance of the results: the higher the non-response rate the lower the informative power of the analysis Estimation Process Average prices of comparable products purchased through and outside of Consip s FCs Organizing the Dataset to create the variables to be used in the regression estimates Regression Estimates to relate purchasing prices to products characetristics Robustness Check Response rate Estimated savings = % Difference between the estimated prices of comparable products purchased through and outside of Consip s FCs 7 Classification: Consip public
The 2012 Survey Distribution of the questionnaire A sample of 1.216 Central and Local Public bodies were asked to participate in an informative survey which aimed at collecting detailed information on the level and composition of public expenditure with respect to the following set of products, among which: office furnitures, car rentals and car purchases, meal vouchers, fuel, paper reams, gas, photocopiers rentals, PCs, telephone and data networks, servers, lighting services, Microsoft Office software, laser printers, mobile and landline telephone services Level of participation The 2012 survey edition was characterized by a satisfying response rate of over 30% Potential limitations A low response rate can give rise to sampling bias if the nonresponse is unequal among the participants regarding observed or unobserved characteristics 8 Classification: Consip public
The estimation process Organizing the Dataset The collected data were elaborated and organized in order to: create homogeneous variables describing products characteristics across different public bodies; construct clusters of public bodies according to their geographical and institutional characteristics; create time-dimensional variables on the basis of invoice dates to account for possible price fluctuations of typically seasonal products (e.g., gas); identify whether or not products/service had been purchased through Consip s FCs Regression estimates The impact of products-specific features on prices was estimated so as to derive purchasing prices of comparable products bought through and outside of Consip FCs; Robustness check The preferred specification model is finally selected according to standard goodness of fit indicators 9 Classification: Consip public
Regression Estimates: Model Specification and Selection The estimated models take the following form: = + + + + + ln( p ) X X ... nX 0 1 1 2 2 n where: p is the purchasing price of each product as reported by the administration; Xz represents the set of each product s characteristics which are thought to affect its purchasing price, with z=1, ,n; bzis the monetized value of each product s characteristics, with consip and no-consipbeing the monetary value of product features which are specific to purchases either under and outside Consip s FCs, respectively; is a residual component, including the influence of unobserved factors on purchasing prices Prices of comparable products purchased through and outside of Consip s FCs contracts are obtained as the difference between the purchasing price p and the value of those features which are specific to purchases either through or outside of Consip s FCs ( consip and no-consip): consip =pconsip consip no-consip = pconsip no-consip 10 Classification: Consip public
Estimated Savings Estimated savings from purchasing under Consip contracts are computed as the percentage difference between the prices of comparable products purchased through and outside of Consip s FCs by type of purchasing body within each geographical area: Consip Contract Estimated savings Type of Administration Area YES NO DIFFERENCE % All Local Bodies Central Bodies North-West (NW) North-East (NE) Center (C) South (S) consip = S 1 consip no-consip no consip 11 Classification: Consip public
Inclusion of SMEs: The Italian Governments e-Marketplace (the MePA) The MePA was launched in 2003: - to promote electronic purchasing (consistent with EU directive) - to streamline purchasing processes - to facilitate SMEs access to low-value procurement market - since July 1st2007 compulsory for central bodies (below EU threshold) Onboarding of the supply side is of paramount importance since it affects: - the variety of supplies (and thus the level of demand) - the level of competition in the long run Identifying the most relevant factors affecting suppliers success is above all instrumental to tailor marketing strategies towards the supply side 12 Classification: Consip public
(Main) Performance indicator for the MePA Policy relevant question Explaining the degree of success of micro, small, medium (and large) firms on the Italian public e-marketplace How effective is e-procurement in opening up public procurement market? 13 Classification: Consip public
Purchasing tools on the MePA Public bodies (PBs) can use 2 different purchasing tools: The Direct Purchase (DP) allows PBs to select goods and services from e- catalogues and buy at the posted price (click-and-buy purchase) The Request for Quotation (RFQ) allows PBs to select a contractor through an on-line simplified price/quality competition among those firms invited to submit a tender 14 Classification: Consip public
Descriptive statistics of DPs in the 2005-2010 sample Distribution of the number and mean value of DPs ( ) per firm s size 2,000 59.7 60 1846.33 1753.28 1,500 DP values ( average) 1316.72 40 1151.76 32.93 Percent 1,000 20 500 5.936 1.429 0 0 0 micro small small medium large micro small medium large firms' size firms' size 15 Classification: Consip public
The Econometric Model (1/2) Ordered Logistic Models (OLM) approach: Appropriate since our dependent variable is a categorical one. The value per each firm s class: 1. 2. 3. 4. Micro firms: Small firms: Medium firms: Large Firms: Y=1 Y=2 Y=3 Y=4 + + exp( + ) X j i j = ( ) for J = 1, 2, 3, M-1 P Y J i 1 {exp( )} X j i j Where M stands for the size of the firm (1 = micro, 2 = small, 3 = medium, 4 = large), X is the vector of explanatory variables, and are the estimated coefficients 16 Classification: Consip public
The Econometric Model (2/2) Value of the contract Variety of the catalogues (posted by suppliers) Main explanatory variables Distance effect Notice Type (ICT and non - ICT) Nature of the public body (central and local) 17 Classification: Consip public
Main Findings (1/2) Higher contract value Higher variety catalogues Higher prob larger firms ICT notice Local public authorities Non-ICT notice Higher prob smaller firms Central public authorities 18 Classification: Consip public
Main Findings (2/2) Low contract value Higher prob smaller firms Higher distance High contract value Higher prob larger firms Lower distance Moral hazard (driven by anonimity?) Geography does (seem to) matter! 19 Classification: Consip public
Probabilities of DPs from classes of suppliers for ICT and the Centre 20 Classification: Consip public
Estimated probabilities for non-ICT notices and all geographical locations but the Centre 21 Classification: Consip public
Main policy implications + Distance effect Contract value effect Reputation mechanisms for reducing moral hazard/anonimity 1 Onboarding of SMEs requires consideration of several dimensions 2 22 Classification: Consip public
Evaluating the impact on a Central Purchasing Body (CPB) on the market The impact of a CPB s action on the market structure and dynamic can be analyzed through indicators relying on data based on the CPB s procurement initiatives only, typically, Framework Contracts orAgreements (FCs or FAs) Such indicators should be computed and evaluated on the single market/category basis and used: to compare different markets among each other to analyze the dynamics of single markets 23 Classification: Consip public
Some Indicators (1/2) Participation N. of bids / N. of lots N. of bidding firms / N. of lots (takes into account temporary groups of firms) Concentration Turnover of the top 3 suppliers in all the editions of the FA / Total turnover of all the editions of the FA Participation patterns Entry index: N. new firms bidding at time t / N. bidders at time t Exit index: N. firms bidding at time t-1 but NOT at time t / N. firms bidding at time t-1 24 Classification: Consip public
Some Indicators (1/2) Example 45 12% 1 78 21% Health Sector 2 N. Bids per Lot 78 21% 3 IT equipement Top 3 suppliers 61 17% 4 Top 5 suppliers TLC 43 12% 5 35 10% Services to real estate 6 Other suppliers Health Sector 16 4% Real Estate 7 0% 50% 100% 7 2% Utilities % of total turnover of FAs 8 TLC 3 1% 9 IT 1 0,3% 10 Absolute figures indicate the absolute number of lots Evaluate the degree of concentration of the managed turnover in different markets or category groups Evaluate the degree of participation in different markets or category groups 25 Classification: Consip public
Squeezing market Dynamic market 80% Energy service hospitals (2) Exit index vs. Entry index 70% mean values over (n) editions of each framework contract 60% Printers (4) PC laptop (5) Exit index 50% Server (4) Gas (2) Facility management (2) Furniture (2) Vehicles (3) 40% Lunch coupons (2) Raw food (3) 30% PC desktop (4) Fuel (3) Expanding market Static market 20% Electricity (5) 10% 0% 10% 20% 30% 40% Entry index 50% 60% 70% 80% 90% Entry index: N. new firms bidding at time t / N. bidders at time t Exit index: N. firms bidding at time t-1 but NOT at time t / N. firms bidding at time t-1 26 Classification: Consip public
 Performance Indicators for")

 Relevant performance indicators")


 Performance indicator for the MePA")


")
")
")
")


 on")
")
")


![Comprehensive Overview of Corruption Watch Submission on Public Procurement Bill [B18B-2023]](/thumb/138344/comprehensive-overview-of-corruption-watch-submission-on-public-procurement-bill-b18b-2023.jpg)