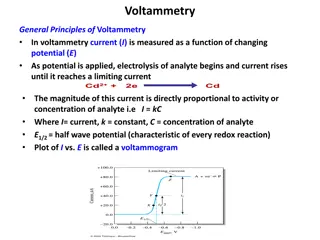
Spectrophotometric Determination of Copper Sulfate Concentration
The experiment aims to determine the concentration of an unknown copper (II) sulfate solution by measuring light absorption at different wavelengths. Colored solutions absorb specific light wavelengths and appear colored to our eyes. By creating a calibration curve and following Beer's Law, the concentration of the unknown solution can be calculated. The procedure involves preparing standard solutions, measuring absorption spectra, and determining the optimum wavelength for absorbance measurements.
Download Presentation
Please find below an Image/Link to download the presentation.
The content on the website is provided AS IS for your information and personal use only. It may not be sold, licensed, or shared on other websites without obtaining consent from the author. Download presentation by click this link. If you encounter any issues during the download, it is possible that the publisher has removed the file from their server.

Presentation Transcript
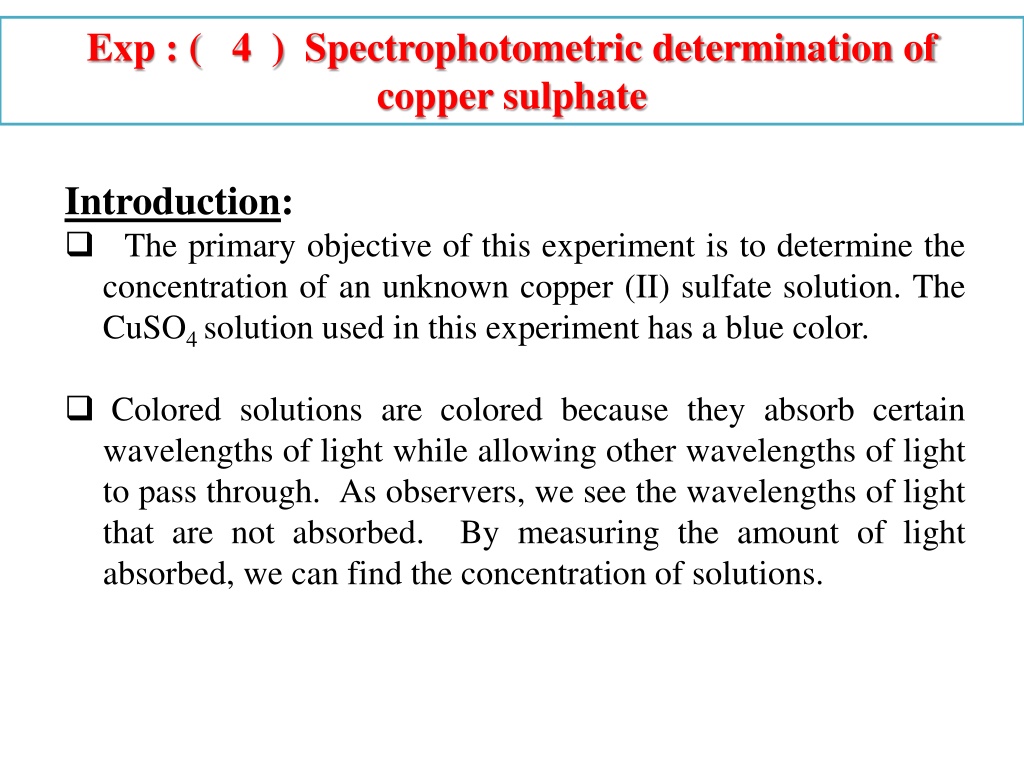
Exp : ( 4 ) Spectrophotometric determination of copper sulphate Introduction: The primary objective of this experiment is to determine the concentration of an unknown copper (II) sulfate solution. The CuSO4 solution used in this experiment has a blue color. Colored solutions are colored because they absorb certain wavelengths of light while allowing other wavelengths of light to pass through. As observers, we see the wavelengths of light that are not absorbed. By measuring the amount of light absorbed, we can find the concentration of solutions.
Anhydrous (without water) CuSO4 is gray-white in colour.but the more common CuSO4.5H2O is a lovely shade of light blue, and CuSO4 is dissolved in water and forms a blue solution. That is because it absorbs light in the red-orange region of the spectrum. So your eyes perceive it a being blue. Before doing this type of spectral analysis, the wavelength at which absorbance is greatest needs to be determined. This is the wavelength to be used for the analysis.[maximum wave length max
How to find maximum wave length ? Maximum wave length gives a maximum absorbance. It can be found by taking the absorbance of a fixed concentration of color solution at different wave length. By plotting a curve between absorbance & wave length we can get the maximum wave-length as shown in this figure: Maximum wave length Wave length Absorbance 590 592 594 596 --- ---- ---- ----- ---- ------ ------ ----- ----- ----- ------ ------
Calibration curve 1- Preparation of standard solution ( stock solution) 2- Preparation of serial standard solution from the stock solution 3- Plot a graph between the concentration and absorbance 4- Find the absorbance of unknown sample Test Tube Concentration of CuSO4 (M) Absorbance 1 2 3 4 5
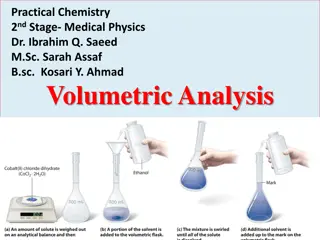
Procedure Exp: ( 4 ) Spectrophotometric determination of CuSO4.5H2O 1- Prepare a standard copper solution at 0.4M by first calculating the required amount of pure CuSO4.5H2O in 100 ml distilled water. The obtained solution is named stock solution. 2-Label five clean, dry, test tubes 1 6. Use pipets to prepare five standard solutions according to the chart below.
Test Tube 0.40 M CuSO4(mL) Distilled H2O(mL) Concentration(M) 1 0 10 2 2 8 3 4 6 4 6 4 5 8 2 6 10 0 3- Measure the absorption spectrum , of this CuSO4.5H2O standard between 590 nm and 700nm , from the absorption spectrum select the optimum wave length to use for all absorbance measurements. By drawing a curve between absorbance and wave length.
4- Measure the absorbance of all six standard solution and the unknown solution after measuring the absorbance of blank solution 5- Draw a calibration curve between absorbance and concentration and find the concentration of the unknown solution.
 Spectrophotometric determination of")
 CuSO4 is gray-white in")