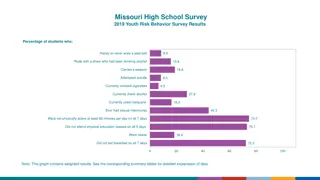
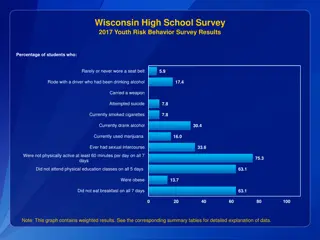
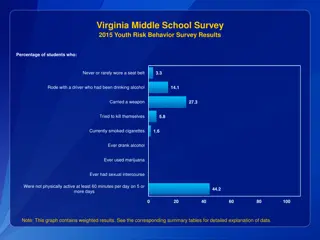
Seat Belt Non-Usage Among High School Students by Sex, Grade, and Race/Ethnicity in 2017
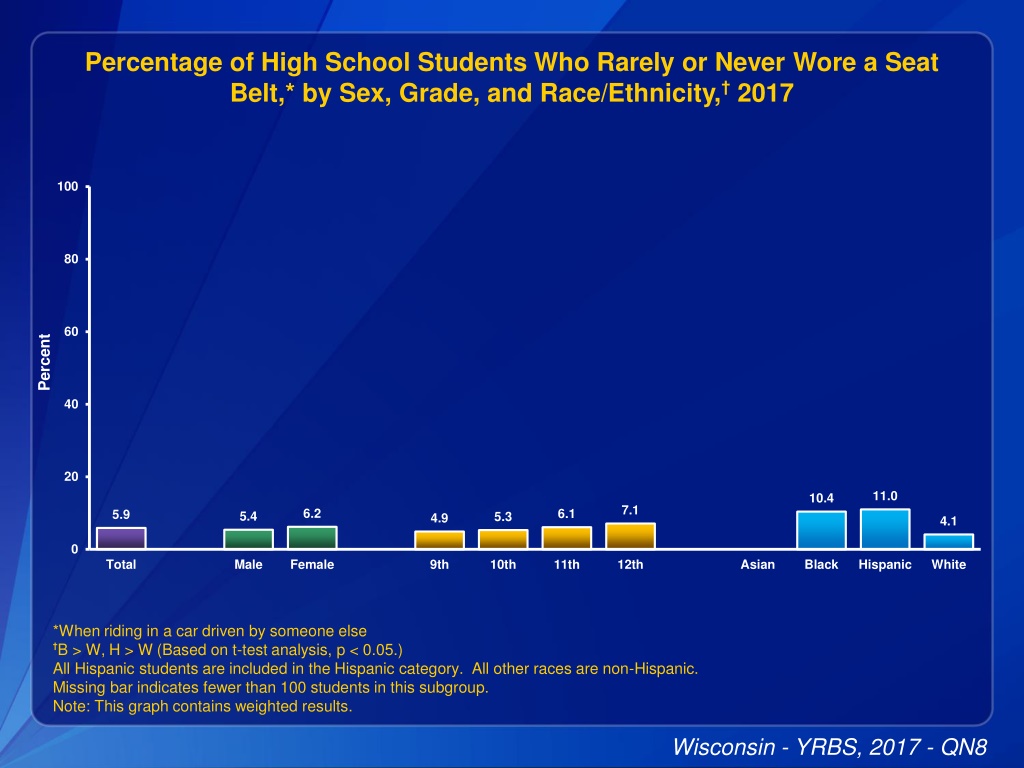
The data from 2017 shows the percentage of high school students who rarely or never wore a seat belt, categorized by sex (male, female), grade (9th, 10th, 11th, 12th), and race/ethnicity (Asian, Black, Hispanic). The percentages range from 11.0% to 4.1%, with variation based on the mentioned factors.

Download Presentation

Please find below an Image/Link to download the presentation.
The content on the website is provided AS IS for your information and personal use only. It may not be sold, licensed, or shared on other websites without obtaining consent from the author. Download presentation by click this link. If you encounter any issues during the download, it is possible that the publisher has removed the file from their server.
E N D
Presentation Transcript
Percentage of High School Students Who Rarely or Never Wore a Seat Belt,* by Sex, Grade, and Race/Ethnicity, 2017 100 80 60 Percent 40 20 11.0 10.4 7.1 6.2 6.1 5.9 5.4 5.3 4.9 4.1 0 Total Male Female 9th 10th 11th 12th Asian Black Hispanic White *When riding in a car driven by someone else B > W, H > W (Based on t-test analysis, p < 0.05.) All Hispanic students are included in the Hispanic category. All other races are non-Hispanic. Missing bar indicates fewer than 100 students in this subgroup. Note: This graph contains weighted results. Wisconsin - YRBS, 2017 - QN8
Percentage of High School Students Who Rarely or Never Wore a Seat Belt,* 1993-2017 100 80 60 Percent 40 29.1 26.4 26.6 20.9 15.2 20 14.6 13.3 13.1 10.3 8.3 5.9 0 1993 1995 1997 1999 2001 2003 2005 2007 2009 2011 2013 2015 2017 *When riding in a car driven by someone else Decreased 1993-2017 [Based on linear and quadratic trend analyses using logistic regression models controlling for sex, race/ethnicity, and grade (p < 0.05). Significant linear trends (if present) across all available years are described first followed by linear changes in each segment of significant quadratic trends (if present).] Data not available for 1995, 2015. Note: This graph contains weighted results. Wisconsin - YRBS, 1993-2017 - QN8
Percentage of High School Students Who Rode with a Driver Who Had Been Drinking Alcohol,* by Sex, Grade, and Race/Ethnicity, 2017 100 80 60 Percent 40 19.5 19.3 18.9 18.9 17.4 17.3 17.1 16.7 16.6 20 14.1 0 Total Male Female 9th 10th 11th 12th Asian Black Hispanic White *In a car or other vehicle, one or more times during the 30 days before the survey All Hispanic students are included in the Hispanic category. All other races are non-Hispanic. Missing bar indicates fewer than 100 students in this subgroup. Note: This graph contains weighted results. Wisconsin - YRBS, 2017 - QN9
Percentage of High School Students Who Rode with a Driver Who Had Been Drinking Alcohol,* 1993-2017 100 80 60 Percent 38.7 37.8 36.3 36.0 40 31.5 31.2 29.7 24.3 22.9 20.6 17.4 20 0 1993 1995 1997 1999 2001 2003 2005 2007 2009 2011 2013 2015 2017 *In a car or other vehicle, one or more times during the 30 days before the survey Decreased 1993-2017, decreased 1993-2007, decreased 2007-2017 [Based on linear and quadratic trend analyses using logistic regression models controlling for sex, race/ethnicity, and grade (p < 0.05). Significant linear trends (if present) across all available years are described first followed by linear changes in each segment of significant quadratic trends (if present).] Data not available for 1995, 2015. Note: This graph contains weighted results. Wisconsin - YRBS, 1993-2017 - QN9
Percentage of High School Students Who Drove a Car or Other Vehicle When They Had Been Drinking Alcohol,* by Sex, Grade, and Race/Ethnicity, 2017 100 80 60 Percent 40 20 9.0 7.2 6.5 5.5 5.5 5.0 4.2 3.4 2.2 0 Total Male Female 9th 10th 11th 12th Asian Black Hispanic White *One or more times during the 30 days before the survey, among students who had driven a car or other vehicle during the 30 days before the survey M > F; 12th > 10th, 12th > 11th (Based on t-test analysis, p < 0.05.) All Hispanic students are included in the Hispanic category. All other races are non-Hispanic. Missing bar indicates fewer than 100 students in this subgroup. Note: This graph contains weighted results. Wisconsin - YRBS, 2017 - QN10
Percentage of High School Students Who Drove a Car or Other Vehicle When They Had Been Drinking Alcohol,* 2013-2017 100 80 60 Percent 40 20 8.9 5.5 0 2013 2015 2017 *One or more times during the 30 days before the survey, among students who had driven a car or other vehicle during the 30 days before the survey Decreased 2013-2017 [Based on linear trend analyses using logistic regression models controlling for sex, race/ethnicity, and grade (p < 0.05).] Data not available for 2015. Note: This graph contains weighted results. Wisconsin - YRBS, 2013-2017 - QN10
Percentage of High School Students Who Texted or E-Mailed While Driving a Car or Other Vehicle,* by Sex, Grade, and Race/Ethnicity, 2017 100 80 61.4 57.0 60 Percent 47.3 47.3 45.7 44.0 38.5 40 22.8 20 14.0 0 Total Male Female 9th 10th 11th 12th Asian Black Hispanic White *On at least 1 day during the 30 days before the survey, among students who had driven a car or other vehicle during the 30 days before the survey 11th > 9th, 11th > 10th, 12th > 9th, 12th > 10th (Based on t-test analysis, p < 0.05.) All Hispanic students are included in the Hispanic category. All other races are non-Hispanic. Missing bar indicates fewer than 100 students in this subgroup. Note: This graph contains weighted results. Wisconsin - YRBS, 2017 - QN11
Percentage of High School Students Who Texted or E-Mailed While Driving a Car or Other Vehicle,* 2013-2017 100 80 60 47.9 Percent 45.7 40 20 0 2013 2015 2017 *On at least 1 day during the 30 days before the survey, among students who had driven a car or other vehicle during the 30 days before the survey No change 2013-2017 [Based on linear trend analyses using logistic regression models controlling for sex, race/ethnicity, and grade (p < 0.05).] Data not available for 2015. Note: This graph contains weighted results. Wisconsin - YRBS, 2013-2017 - QN11
Percentage of High School Students Who Carried a Weapon on School Property,* by Sex, Grade, and Race/Ethnicity, 2017 100 80 60 Percent 40 20 8.2 6.6 5.9 5.6 5.2 4.3 4.2 4.1 3.8 3.5 0 Total Male Female 9th 10th 11th 12th Asian Black Hispanic White *Such as a gun, knife, or club, on at least 1 day during the 30 days before the survey M > F (Based on t-test analysis, p < 0.05.) All Hispanic students are included in the Hispanic category. All other races are non-Hispanic. Missing bar indicates fewer than 100 students in this subgroup. Note: This graph contains weighted results. Wisconsin - YRBS, 2017 - QN13
Percentage of High School Students Who Carried a Weapon on School Property,* 1993-2017 100 80 60 Percent 40 20 9.0 5.5 5.2 5.4 3.9 3.6 3.4 3.4 3.2 3.2 3.1 0 1993 1995 1997 1999 2001 2003 2005 2007 2009 2011 2013 2015 2017 *Such as a gun, knife, or club, on at least 1 day during the 30 days before the survey Decreased 1993-2017, decreased 1993-2001, no change 2001-2017 [Based on linear and quadratic trend analyses using logistic regression models controlling for sex, race/ethnicity, and grade (p < 0.05). Significant linear trends (if present) across all available years are described first followed by linear changes in each segment of significant quadratic trends (if present).] Data not available for 1995, 2015. Note: This graph contains weighted results. Wisconsin - YRBS, 1993-2017 - QN13
Percentage of High School Students Who Carried a Gun,* by Sex, Grade, and Race/Ethnicity, 2017 100 80 60 Percent 40 20 10.4 7.8 6.2 5.8 5.2 4.9 4.6 4.4 3.9 1.8 0 Total Male Female 9th 10th 11th 12th Asian Black Hispanic White *Not counting the days when they carried a gun only for hunting or for a sport such as target shooting, on at least 1 day during the 12 months before the survey M > F; H > W (Based on t-test analysis, p < 0.05.) All Hispanic students are included in the Hispanic category. All other races are non-Hispanic. Missing bar indicates fewer than 100 students in this subgroup. Note: This graph contains weighted results. Wisconsin - YRBS, 2017 - QN14
Percentage of High School Students Who Did Not Go to School Because They Felt Unsafe at School or on Their Way to or from School,* by Sex, Grade, and Race/Ethnicity, 2017 100 80 60 Percent 40 20 10.4 8.1 7.6 6.9 6.4 6.3 6.3 5.3 5.1 5.0 0 Total Male Female 9th 10th 11th 12th Asian Black Hispanic White *On at least 1 day during the 30 days before the survey F > M; B > W (Based on t-test analysis, p < 0.05.) All Hispanic students are included in the Hispanic category. All other races are non-Hispanic. Missing bar indicates fewer than 100 students in this subgroup. Note: This graph contains weighted results. Wisconsin - YRBS, 2017 - QN15
Percentage of High School Students Who Did Not Go to School Because They Felt Unsafe at School or on Their Way to or from School,* 1993- 2017 100 80 60 Percent 40 20 6.3 6.3 6.0 5.8 5.8 5.6 4.6 3.7 3.7 3.4 3.4 0 1993 1995 1997 1999 2001 2003 2005 2007 2009 2011 2013 2015 2017 *On at least 1 day during the 30 days before the survey No change 1993-2017 [Based on linear and quadratic trend analyses using logistic regression models controlling for sex, race/ethnicity, and grade (p < 0.05). Significant linear trends (if present) across all available years are described first followed by linear changes in each segment of significant quadratic trends (if present).] Data not available for 1995, 2015. Note: This graph contains weighted results. Wisconsin - YRBS, 1993-2017 - QN15
Percentage of High School Students Who Were Threatened or Injured with a Weapon on School Property,* by Sex, Grade, and Race/Ethnicity, 2017 100 80 60 Percent 40 20 12.6 8.9 8.7 8.2 8.2 6.9 5.8 5.6 4.8 4.7 0 Total Male Female 9th 10th 11th 12th Asian Black Hispanic White *Such as a gun, knife, or club, one or more times during the 12 months before the survey M > F (Based on t-test analysis, p < 0.05.) All Hispanic students are included in the Hispanic category. All other races are non-Hispanic. Missing bar indicates fewer than 100 students in this subgroup. Note: This graph contains weighted results. Wisconsin - YRBS, 2017 - QN16
Percentage of High School Students Who Were Threatened or Injured with a Weapon on School Property,* 1993-2017 100 80 60 Percent 40 20 8.4 7.9 7.6 7.6 7.8 6.9 6.7 5.6 5.5 5.1 4.3 0 1993 1995 1997 1999 2001 2003 2005 2007 2009 2011 2013 2015 2017 *Such as a gun, knife, or club, one or more times during the 12 months before the survey Decreased 1993-2017 [Based on linear and quadratic trend analyses using logistic regression models controlling for sex, race/ethnicity, and grade (p < 0.05). Significant linear trends (if present) across all available years are described first followed by linear changes in each segment of significant quadratic trends (if present).] Data not available for 1995, 2015. Note: This graph contains weighted results. Wisconsin - YRBS, 1993-2017 - QN16
Percentage of High School Students Who Were in a Physical Fight,* by Sex, Grade, and Race/Ethnicity, 2017 100 80 60 Percent 40 29.9 26.7 26.0 23.9 21.6 20.0 18.6 17.1 20 14.5 12.8 0 Total Male Female 9th 10th 11th 12th Asian Black Hispanic White *One or more times during the 12 months before the survey M > F; 9th > 12th; B > W, H > W (Based on t-test analysis, p < 0.05.) All Hispanic students are included in the Hispanic category. All other races are non-Hispanic. Missing bar indicates fewer than 100 students in this subgroup. Note: This graph contains weighted results. Wisconsin - YRBS, 2017 - QN17
Percentage of High School Students Who Were in a Physical Fight,* 1993- 2017 100 80 60 Percent 39.4 40 34.0 33.1 32.6 31.4 31.4 31.2 25.8 25.3 22.4 20.0 20 0 1993 1995 1997 1999 2001 2003 2005 2007 2009 2011 2013 2015 2017 *One or more times during the 12 months before the survey Decreased 1993-2017, decreased 1993-2007, decreased 2007-2017 [Based on linear and quadratic trend analyses using logistic regression models controlling for sex, race/ethnicity, and grade (p < 0.05). Significant linear trends (if present) across all available years are described first followed by linear changes in each segment of significant quadratic trends (if present).] Data not available for 1995, 2015. Note: This graph contains weighted results. Wisconsin - YRBS, 1993-2017 - QN17
Percentage of High School Students Who Were in a Physical Fight on School Property,* by Sex, Grade, and Race/Ethnicity, 2017 100 80 60 Percent 40 20 13.2 11.1 10.3 9.8 8.8 7.3 5.6 5.0 5.0 3.7 0 Total Male Female 9th 10th 11th 12th Asian Black Hispanic White *One or more times during the 12 months before the survey M > F; 9th > 11th, 9th > 12th, 10th > 11th, 10th > 12th; B > W, H > W (Based on t-test analysis, p < 0.05.) All Hispanic students are included in the Hispanic category. All other races are non-Hispanic. Missing bar indicates fewer than 100 students in this subgroup. Note: This graph contains weighted results. Wisconsin - YRBS, 2017 - QN18
Percentage of High School Students Who Were in a Physical Fight on School Property,* 1993-2017 100 80 60 Percent 40 16.1 20 13.5 12.2 11.6 11.4 11.4 11.3 9.6 9.1 7.3 6.8 0 1993 1995 1997 1999 2001 2003 2005 2007 2009 2011 2013 2015 2017 *One or more times during the 12 months before the survey Decreased 1993-2017 [Based on linear and quadratic trend analyses using logistic regression models controlling for sex, race/ethnicity, and grade (p < 0.05). Significant linear trends (if present) across all available years are described first followed by linear changes in each segment of significant quadratic trends (if present).] Data not available for 1995, 2015. Note: This graph contains weighted results. Wisconsin - YRBS, 1993-2017 - QN18
Percentage of High School Students Who Were Ever Physically Forced to Have Sexual Intercourse,* by Sex, Grade, and Race/Ethnicity, 2017 100 80 60 Percent 40 20 10.0 9.8 8.9 7.2 7.0 6.9 6.6 5.9 5.9 5.1 0 Total Male Female 9th 10th 11th 12th Asian Black Hispanic White *When they did not want to F > M; 12th > 10th (Based on t-test analysis, p < 0.05.) All Hispanic students are included in the Hispanic category. All other races are non-Hispanic. Missing bar indicates fewer than 100 students in this subgroup. Note: This graph contains weighted results. Wisconsin - YRBS, 2017 - QN19
Percentage of High School Students Who Experienced Sexual Dating Violence,* by Sex, Grade, and Race/Ethnicity, 2017 100 80 60 Percent 40 20 15.0 11.6 11.0 10.6 10.2 10.1 9.5 8.6 5.0 0 Total Male Female 9th 10th 11th 12th Asian Black Hispanic White *Being forced by someone they were dating or going out with to do sexual things [counting such things as kissing, touching, or being physically forced to have sexual intercourse] that they did not want to, one or more times during the 12 months before the survey, among students who dated or went out with someone during the 12 months before the survey F > M (Based on t-test analysis, p < 0.05.) All Hispanic students are included in the Hispanic category. All other races are non-Hispanic. Missing bar indicates fewer than 100 students in this subgroup. Note: This graph contains weighted results. Wisconsin - YRBS, 2017 - QN21
Percentage of High School Students Who Experienced Sexual Dating Violence,* 2013-2017 100 80 60 Percent 40 20 10.2 9.6 0 2013 2015 2017 *Being forced by someone they were dating or going out with to do sexual things [counting such things as kissing, touching, or being physically forced to have sexual intercourse] that they did not want to, one or more times during the 12 months before the survey, among students who dated or went out with someone during the 12 months before the survey No change 2013-2017 [Based on linear trend analyses using logistic regression models controlling for sex, race/ethnicity, and grade (p < 0.05).] Data not available for 2015. Note: This graph contains weighted results. Wisconsin - YRBS, 2013-2017 - QN21
Percentage of High School Students Who Experienced Physical Dating Violence,* by Sex, Grade, and Race/Ethnicity, 2017 100 80 60 Percent 40 20 8.8 8.2 8.0 7.5 6.9 6.9 6.3 4.5 4.1 0 Total Male Female 9th 10th 11th 12th Asian Black Hispanic White *Being physically hurt on purpose by someone they were dating or going out with [counting such things as being hit, slammed into something, or injured with an object or weapon] one or more times during the 12 months before the survey, among students who dated or went out with someone during the 12 months before the survey F > M; 12th > 9th (Based on t-test analysis, p < 0.05.) All Hispanic students are included in the Hispanic category. All other races are non-Hispanic. Missing bar indicates fewer than 100 students in this subgroup. Note: This graph contains weighted results. Wisconsin - YRBS, 2017 - QN22
Percentage of High School Students Who Experienced Physical Dating Violence,* 2013-2017 100 80 60 Percent 40 20 8.5 6.9 0 2013 2015 2017 *Being physically hurt on purpose by someone they were dating or going out with [counting such things as being hit, slammed into something, or injured with an object or weapon] one or more times during the 12 months before the survey, among students who dated or went out with someone during the 12 months before the survey No change 2013-2017 [Based on linear trend analyses using logistic regression models controlling for sex, race/ethnicity, and grade (p < 0.05).] Data not available for 2015. Note: This graph contains weighted results. Wisconsin - YRBS, 2013-2017 - QN22
Percentage of High School Students Who Were Bullied on School Property,* by Sex, Grade, and Race/Ethnicity, 2017 100 80 60 Percent 40 32.5 28.3 26.0 25.0 24.2 20.1 19.9 19.3 18.1 20 13.2 0 Total Male Female 9th 10th 11th 12th Asian Black Hispanic White *Ever during the 12 months before the survey F > M; 9th > 11th, 9th > 12th, 10th > 11th, 10th > 12th; W > B (Based on t-test analysis, p < 0.05.) All Hispanic students are included in the Hispanic category. All other races are non-Hispanic. Missing bar indicates fewer than 100 students in this subgroup. Note: This graph contains weighted results. Wisconsin - YRBS, 2017 - QN23
Percentage of High School Students Who Were Bullied on School Property,* 2009-2017 100 80 60 Percent 40 24.2 24.0 22.5 22.7 20 0 2009 2011 2013 2015 2017 *Ever during the 12 months before the survey No change 2009-2017 [Based on linear trend analyses using logistic regression models controlling for sex, race/ethnicity, and grade (p < 0.05).] Data not available for 2015. Note: This graph contains weighted results. Wisconsin - YRBS, 2009-2017 - QN23
Percentage of High School Students Who Were Electronically Bullied,* by Sex, Grade, and Race/Ethnicity, 2017 100 80 60 Percent 40 24.9 23.0 18.4 18.3 17.6 17.4 16.8 20 15.8 15.1 11.9 0 Total Male Female 9th 10th 11th 12th Asian Black Hispanic White *Counting being bullied through texting, Instagram, Facebook, or other social media, ever during the 12 months before the survey F > M; 9th > 10th, 9th > 11th, 9th > 12th (Based on t-test analysis, p < 0.05.) All Hispanic students are included in the Hispanic category. All other races are non-Hispanic. Missing bar indicates fewer than 100 students in this subgroup. Note: This graph contains weighted results. Wisconsin - YRBS, 2017 - QN24
Percentage of High School Students Who Were Electronically Bullied,* 2011-2017 100 80 60 Percent 40 18.3 17.6 16.6 20 0 2011 2013 2015 2017 *Counting being bullied through texting, Instagram, Facebook, or other social media, ever during the 12 months before the survey No change 2011-2017 [Based on linear trend analyses using logistic regression models controlling for sex, race/ethnicity, and grade (p < 0.05).] Data not available for 2015. Note: This graph contains weighted results. Wisconsin - YRBS, 2011-2017 - QN24
Percentage of High School Students Who Felt Sad or Hopeless,* by Sex, Grade, and Race/Ethnicity, 2017 100 80 60 Percent 38.1 40 31.6 31.0 27.5 27.0 26.9 26.9 25.6 25.3 20 16.2 0 Total Male Female 9th 10th 11th 12th Asian Black Hispanic White *Almost every day for >=2 weeks in a row so that they stopped doing some usual activities, ever during the 12 months before the survey F > M (Based on t-test analysis, p < 0.05.) All Hispanic students are included in the Hispanic category. All other races are non-Hispanic. Missing bar indicates fewer than 100 students in this subgroup. Note: This graph contains weighted results. Wisconsin - YRBS, 2017 - QN25
Percentage of High School Students Who Felt Sad or Hopeless,* 1999- 2017 100 80 60 Percent 40 27.7 27.6 27.0 26.7 25.3 24.6 22.7 22.4 20.8 20 0 1999 2001 2003 2005 2007 2009 2011 2013 2015 2017 *Almost every day for >=2 weeks in a row so that they stopped doing some usual activities, ever during the 12 months before the survey Decreased 1999-2017, decreased 1999-2009, increased 2009-2017 [Based on linear and quadratic trend analyses using logistic regression models controlling for sex, race/ethnicity, and grade (p < 0.05). Significant linear trends (if present) across all available years are described first followed by linear changes in each segment of significant quadratic trends (if present).] Data not available for 2015. Note: This graph contains weighted results. Wisconsin - YRBS, 1999-2017 - QN25
Percentage of High School Students Who Seriously Considered Attempting Suicide,* by Sex, Grade, and Race/Ethnicity, 2017 100 80 60 Percent 40 23.2 22.4 17.2 17.0 16.4 20 15.8 15.7 15.1 15.1 10.3 0 Total Male Female 9th 10th 11th 12th Asian Black Hispanic White *Ever during the 12 months before the survey F > M (Based on t-test analysis, p < 0.05.) All Hispanic students are included in the Hispanic category. All other races are non-Hispanic. Missing bar indicates fewer than 100 students in this subgroup. Note: This graph contains weighted results. Wisconsin - YRBS, 2017 - QN26
Percentage of High School Students Who Seriously Considered Attempting Suicide,* 1993-2017 100 80 60 Percent 40 27.4 24.1 22.4 19.9 19.6 17.8 16.4 15.0 20 13.5 13.2 13.2 0 1993 1995 1997 1999 2001 2003 2005 2007 2009 2011 2013 2015 2017 *Ever during the 12 months before the survey Decreased 1993-2017, decreased 1993-2011, increased 2011-2017 [Based on linear and quadratic trend analyses using logistic regression models controlling for sex, race/ethnicity, and grade (p < 0.05). Significant linear trends (if present) across all available years are described first followed by linear changes in each segment of significant quadratic trends (if present).] Data not available for 1995, 2015. Note: This graph contains weighted results. Wisconsin - YRBS, 1993-2017 - QN26
Percentage of High School Students Who Made a Plan About How They Would Attempt Suicide,* by Sex, Grade, and Race/Ethnicity, 2017 100 80 60 Percent 40 20.2 18.6 18.3 20 16.2 16.0 15.0 14.5 13.1 12.7 11.2 0 Total Male Female 9th 10th 11th 12th Asian Black Hispanic White *During the 12 months before the survey F > M; B > W (Based on t-test analysis, p < 0.05.) All Hispanic students are included in the Hispanic category. All other races are non-Hispanic. Missing bar indicates fewer than 100 students in this subgroup. Note: This graph contains weighted results. Wisconsin - YRBS, 2017 - QN27
Percentage of High School Students Who Made a Plan About How They Would Attempt Suicide,* 2005-2017 100 80 60 Percent 40 15.4 15.0 20 12.1 11.5 11.0 10.3 0 2005 2007 2009 2011 2013 2015 2017 *During the 12 months before the survey Decreased, 2005-2009, increased, 2009-2017 [Based on linear and quadratic trend analyses using logistic regression models controlling for sex, race/ethnicity, and grade (p < 0.05). Significant linear trends (if present) across all available years are described first followed by linear changes in each segment of significant quadratic trends (if present).] Data not available for 2015. Note: This graph contains weighted results. Wisconsin - YRBS, 2005-2017 - QN27
Percentage of High School Students Who Attempted Suicide,* by Sex, Grade, and Race/Ethnicity, 2017 100 80 60 Percent 40 20 9.9 9.2 8.2 7.8 7.5 7.3 7.3 6.2 6.2 0 Total Male Female 9th 10th 11th 12th Asian Black Hispanic White *One or more times during the 12 months before the survey F > M (Based on t-test analysis, p < 0.05.) All Hispanic students are included in the Hispanic category. All other races are non-Hispanic. Missing bar indicates fewer than 100 students in this subgroup. Note: This graph contains weighted results. Wisconsin - YRBS, 2017 - QN28
Percentage of High School Students Who Attempted Suicide,* 1999-2017 100 80 60 Percent 40 20 8.8 8.6 8.2 7.8 8.2 7.3 6.7 6.0 5.8 0 1999 2001 2003 2005 2007 2009 2011 2013 2015 2017 *One or more times during the 12 months before the survey Decreased 1999-2017 [Based on linear and quadratic trend analyses using logistic regression models controlling for sex, race/ethnicity, and grade (p < 0.05). Significant linear trends (if present) across all available years are described first followed by linear changes in each segment of significant quadratic trends (if present).] Data not available for 2015. Note: This graph contains weighted results. Wisconsin - YRBS, 1999-2017 - QN28
Percentage of High School Students Who Had a Suicide Attempt That Resulted in an Injury, Poisoning, or Overdose That Had to Be Treated by a Doctor or Nurse,* by Sex, Grade, and Race/Ethnicity, 2017 100 80 60 Percent 40 20 3.3 3.0 2.8 2.7 2.5 2.2 2.1 2.0 1.7 0 Total Male Female 9th 10th 11th 12th Asian Black Hispanic White *During the 12 months before the survey All Hispanic students are included in the Hispanic category. All other races are non-Hispanic. Missing bar indicates fewer than 100 students in this subgroup. Note: This graph contains weighted results. Wisconsin - YRBS, 2017 - QN29
Percentage of High School Students Who Had a Suicide Attempt That Resulted in an Injury, Poisoning, or Overdose That Had to Be Treated by a Doctor or Nurse,* 1993-2017 100 80 60 Percent 40 20 4.0 3.0 2.8 2.6 2.5 2.5 2.5 2.5 2.4 2.1 1.7 0 1993 1995 1997 1999 2001 2003 2005 2007 2009 2011 2013 2015 2017 *During the 12 months before the survey Decreased 1993-2017 [Based on linear and quadratic trend analyses using logistic regression models controlling for sex, race/ethnicity, and grade (p < 0.05). Significant linear trends (if present) across all available years are described first followed by linear changes in each segment of significant quadratic trends (if present).] Data not available for 1995, 2015. Note: This graph contains weighted results. Wisconsin - YRBS, 1993-2017 - QN29
Percentage of High School Students Who Ever Tried Cigarette Smoking,* by Sex, Grade, and Race/Ethnicity, 2017 100 80 60 Percent 40 31.9 31.7 25.3 25.2 24.4 23.7 23.7 21.4 19.4 18.8 20 0 Total Male Female 9th 10th 11th 12th Asian Black Hispanic White *Even one or two puffs 12th > 9th, 12th > 10th; H > B (Based on t-test analysis, p < 0.05.) All Hispanic students are included in the Hispanic category. All other races are non-Hispanic. Missing bar indicates fewer than 100 students in this subgroup. Note: This graph contains weighted results. Wisconsin - YRBS, 2017 - QN30
Percentage of High School Students Who Ever Tried Cigarette Smoking,* 2001-2017 100 80 64.0 60 54.1 51.5 49.0 Percent 43.6 40.7 40 33.2 24.4 20 0 2001 2003 2005 2007 2009 2011 2013 2015 2017 *Even one or two puffs Decreased 2001-2017 [Based on linear and quadratic trend analyses using logistic regression models controlling for sex, race/ethnicity, and grade (p < 0.05). Significant linear trends (if present) across all available years are described first followed by linear changes in each segment of significant quadratic trends (if present).] Data not available for 2015. Note: This graph contains weighted results. Wisconsin - YRBS, 2001-2017 - QN30
Percentage of High School Students Who First Tried Cigarette Smoking Before Age 13 Years,* by Sex, Grade, and Race/Ethnicity, 2017 100 80 60 Percent 40 20 11.7 10.1 10.0 8.6 7.9 7.6 7.1 6.6 6.2 5.1 0 Total Male Female 9th 10th 11th 12th Asian Black Hispanic White *Even one or two puffs 9th > 11th, 12th > 11th (Based on t-test analysis, p < 0.05.) All Hispanic students are included in the Hispanic category. All other races are non-Hispanic. Missing bar indicates fewer than 100 students in this subgroup. Note: This graph contains weighted results. Wisconsin - YRBS, 2017 - QN31
Percentage of High School Students Who Currently Smoked Cigarettes,* by Sex, Grade, and Race/Ethnicity, 2017 100 80 60 Percent 40 20 13.4 9.1 8.0 7.8 7.4 6.4 6.2 5.4 4.9 4.1 0 Total Male Female 9th 10th 11th 12th Asian Black Hispanic White *On at least 1 day during the 30 days before the survey M > F; 12th > 9th, 12th > 10th, 12th > 11th; W > H (Based on t-test analysis, p < 0.05.) All Hispanic students are included in the Hispanic category. All other races are non-Hispanic. Missing bar indicates fewer than 100 students in this subgroup. Note: This graph contains weighted results. Wisconsin - YRBS, 2017 - QN32
Percentage of High School Students Who Currently Smoked Cigarettes,* 1993-2017 100 80 60 Percent 38.1 36.0 40 32.6 31.8 23.6 22.8 20.5 16.9 20 14.6 11.8 7.8 0 1993 1995 1997 1999 2001 2003 2005 2007 2009 2011 2013 2015 2017 *On at least 1 day during the 30 days before the survey Decreased 1993-2017, increased 1993-1999, decreased 1999-2017 [Based on linear and quadratic trend analyses using logistic regression models controlling for sex, race/ethnicity, and grade (p < 0.05). Significant linear trends (if present) across all available years are described first followed by linear changes in each segment of significant quadratic trends (if present).] Data not available for 1995, 2015. Note: This graph contains weighted results. Wisconsin - YRBS, 1993-2017 - QN32
Percentage of High School Students Who Currently Smoked Cigarettes Frequently,* by Sex, Grade, and Race/Ethnicity, 2017 100 80 60 Percent 40 20 3.7 2.6 2.5 2.3 2.3 2.0 1.9 1.8 1.4 0.7 0 Total Male Female 9th 10th 11th 12th Asian Black Hispanic White *On 20 or more days during the 30 days before the survey W > H (Based on t-test analysis, p < 0.05.) All Hispanic students are included in the Hispanic category. All other races are non-Hispanic. Missing bar indicates fewer than 100 students in this subgroup. Note: This graph contains weighted results. Wisconsin - YRBS, 2017 - QNFRCIG
Percentage of High School Students Who Currently Smoked Cigarettes Frequently,* 1993-2017 100 80 60 Percent 40 21.7 19.5 16.4 15.8 20 11.6 10.7 9.4 7.1 5.2 4.3 2.3 0 1993 1995 1997 1999 2001 2003 2005 2007 2009 2011 2013 2015 2017 *On 20 or more days during the 30 days before the survey Decreased 1993-2017, increased 1993-1999, decreased 1999-2017 [Based on linear and quadratic trend analyses using logistic regression models controlling for sex, race/ethnicity, and grade (p < 0.05). Significant linear trends (if present) across all available years are described first followed by linear changes in each segment of significant quadratic trends (if present).] Data not available for 1995, 2015. Note: This graph contains weighted results. Wisconsin - YRBS, 1993-2017 - QNFRCIG
Percentage of High School Students Who Currently Smoked Cigarettes Daily,* by Sex, Grade, and Race/Ethnicity, 2017 100 80 60 Percent 40 20 3.1 1.8 1.7 1.6 1.5 1.3 1.0 0.7 0.7 0.7 0 Total Male Female 9th 10th 11th 12th Asian Black Hispanic White *On all 30 days during the 30 days before the survey 10th > 9th, 12th > 9th, 12th > 11th; W > H (Based on t-test analysis, p < 0.05.) All Hispanic students are included in the Hispanic category. All other races are non-Hispanic. Missing bar indicates fewer than 100 students in this subgroup. Note: This graph contains weighted results. Wisconsin - YRBS, 2017 - QNDAYCIG
Percentage of High School Students Who Currently Smoked Cigarettes Daily,* 1993-2017 100 80 60 Percent 40 16.6 15.5 20 12.7 10.8 8.4 7.6 6.4 4.9 3.5 3.3 1.5 0 1993 1995 1997 1999 2001 2003 2005 2007 2009 2011 2013 2015 2017 *On all 30 days during the 30 days before the survey Decreased 1993-2017, increased 1993-1999, decreased 1999-2017 [Based on linear and quadratic trend analyses using logistic regression models controlling for sex, race/ethnicity, and grade (p < 0.05). Significant linear trends (if present) across all available years are described first followed by linear changes in each segment of significant quadratic trends (if present).] Data not available for 1995, 2015. Note: This graph contains weighted results. Wisconsin - YRBS, 1993-2017 - QNDAYCIG
Percentage of High School Students Who Smoked More Than 10 Cigarettes Per Day,* by Sex, Grade, and Race/Ethnicity, 2017 100 80 60 Percent 40 20 9.7 8.2 0 Total Male Female 9th 10th 11th 12th Asian Black Hispanic White *On the days they smoked during the 30 days before the survey, among students who currently smoked cigarettes All Hispanic students are included in the Hispanic category. All other races are non-Hispanic. Missing bar indicates fewer than 100 students in this subgroup. Note: This graph contains weighted results. Wisconsin - YRBS, 2017 - QN33
Percentage of High School Students Who Smoked More Than 10 Cigarettes Per Day,* 1993-2017 100 80 60 Percent 40 19.8 15.8 15.4 20 12.5 9.8 9.7 9.3 9.2 8.3 6.2 3.9 0 1993 1995 1997 1999 2001 2003 2005 2007 2009 2011 2013 2015 2017 *On the days they smoked during the 30 days before the survey, among students who currently smoked cigarettes Decreased 1993-2017 [Based on linear and quadratic trend analyses using logistic regression models controlling for sex, race/ethnicity, and grade (p < 0.05). Significant linear trends (if present) across all available years are described first followed by linear changes in each segment of significant quadratic trends (if present).] Data not available for 1995, 2015. Note: This graph contains weighted results. Wisconsin - YRBS, 1993-2017 - QN33
Percentage of High School Students Who Currently Used an Electronic Vapor Product,* by Sex, Grade, and Race/Ethnicity, 2017 100 80 60 Percent 40 18.9 20 14.0 13.0 12.7 11.6 8.9 8.8 8.3 6.6 5.7 0 Total Male Female 9th 10th 11th 12th Asian Black Hispanic White *Including e-cigarettes, e-cigars, e-pipes, vape pipes, vaping pens, e-hookahs, and hookah pens [such as blu, NJOY, Vuse, MarkTen, Logic, Vapin Plus, eGo, and Halo], on at least 1 day during the 30 days before the survey M > F; 11th > 9th, 12th > 9th, 12th > 10th; W > B, W > H (Based on t-test analysis, p < 0.05.) All Hispanic students are included in the Hispanic category. All other races are non-Hispanic. Missing bar indicates fewer than 100 students in this subgroup. Note: This graph contains weighted results. Wisconsin - YRBS, 2017 - QN35