Analysis of Disproportionality in Special Education Disciplinary Practices

This document delves into the issue of disproportionality in special education disciplinary practices, focusing on suspension and expulsion rates among students with Individualized Education Programs (IEPs). It highlights significant differences in rates based on race/ethnicity and outlines indicators and methodology for identifying discrepancies. The data presented from various school districts illustrates disparities in disciplinary actions and their impact on different student groups within the education system.

Download Presentation

Please find below an Image/Link to download the presentation.
The content on the website is provided AS IS for your information and personal use only. It may not be sold, licensed, or shared on other websites without obtaining consent from the author. Download presentation by click this link. If you encounter any issues during the download, it is possible that the publisher has removed the file from their server.
E N D
Presentation Transcript
WELCOME Introductions Blytheville Pine Bluff Dewitt Brinkley Rivercrest Disproportionality Institute March 29-30, 2018 Little Rock, Arkansas What is on your table? Agenda District current Disproportionality Profile Root Cause Flow Chart
Special Education Annual Performance Report Indicators I-4A & 4B: Discipline I-9: Disproportionate Representation in Identification I-10: Disproportionate Representation in a Specific Disability Category HOW DID YOU GET HERE?
2017 Indicator 4A (Difference > 1.36) Indicator 4B (Difference >4) Sp. Ed Rate Gen. Ed. Rate Rate Sp. Ed. Rate for Black Gen. Ed. Rate for All Races Black Difference Difference 10.7 9.44 DEWITT SCHOOL DISTRICT PINE BLUFF SCHOOL DISTRICT BLYTHEVILLE SCHOOL DISTRICT RIVERCREST SCHOOL DISTRICT BRINKLEY SCHOOL DISTRICT 3.03% 6.40% 7.27% 3.92% 6.74% 1.27% 4.88% 3.40% 0.40% 2.98% 1.76% 1.52% 3.87% 3.52% 3.76% 1.27% Your Data at a Glance 7.98 7.69 8.47 4.59 7.29 5.50 3.40% 0.40% 2.98% 2018 Indicator 4A (Difference > 1.36) Indicator 4B (Difference >4) Sp. Ed Rate Rate Sp. Ed Rate for Black Gen. Ed. Rate for All Races Black Difference Gen. Ed. Rate Difference 6.90 13.11 6.90 10.00 9.44 7.70 4.24 9.50 DEWITT SCHOOL DISTRICT PINE BLUFF SCHOOL DISTRICT BLYTHEVILLE SCHOOL DISTRICT RIVERCREST SCHOOL DISTRICT BRINKLEY SCHOOL DISTRICT 1.02 5.42 2.65 0.50 12.67% 5.71% 2.63% 3.70% 5.42% 2.65% 0.50% 1.83% 7.25% 3.06% 2.13% 1.88%
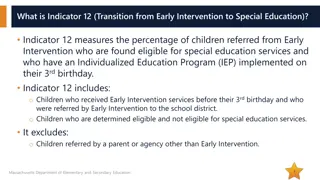
Indicator 4A: Suspension/Expulsion Rates of suspension and expulsion: A. Percent of districts that have a significant discrepancy in the rate of suspensions and expulsions of greater than 10 days in a school year for children with IEPs; and Indicators and Current Methodology B. Percent of districts that have: (a) a significant discrepancy, by race or ethnicity, in the rate of suspensions and expulsions of greater than 10 days in a school year for children with IEPs; and (b) policies, procedures or practices that contribute to the significant discrepancy and do not comply with requirements relating to the development and implementation of IEPs, the use of positive behavioral interventions and supports, and procedural safeguards. Significant Difference is identified if the special education rate is 1.36 percentage points higher than the general education rate.
Indicator 4B: Suspension/Expulsion Rates of suspension and expulsion: A. Percent of districts that have a significant discrepancy in the rate of suspensions and expulsions of greater than 10 days in a school year for children with IEPs; and Indicators and Current Methodology B. Percent of districts that have: (a) a significant discrepancy, by race or ethnicity, in the rate of suspensions and expulsions of greater than 10 days in a school year for children with IEPs; and (b) policies, procedures or practices that contribute to the significant discrepancy and do not comply with requirements relating to the development and implementation of IEPs, the use of positive behavioral interventions and supports, and procedural safeguards. Significant Difference is identified if the rate for a racial/ethnicity category within special education when compared to all racial/ethnic groups in general education is greater than 4 percentage points than the general education rate.
Presenters Belinda Kittrell, ADE Research & Technology Cindy Wilkerson, ADE Research & Technology Nancy O Hara, IDEA Data Center Terry Long, IDEA Data Center Let s Get Started!
Who handles discipline data in the schools? Principal Assistant Principal Secretary Is there a set data entry form used across the district? Is the district using the state codes or having to convert from district codes to the state codes for Cycle 7? Has the person filling out the discipline report been trained on the meaning of the various discipline codes? What is out-of-school suspension vs. expulsion? Do they realize an expulsion requires school board approval? Removal from a building to an ALE or homebound is not an expulsion or suspension? A student moved to homebound for discipline is still enrolled in the building that supports their grade level Data Quality
Common Errors The Action Taken was coded as an expulsion because the student has been removed from the building to an alternate setting. Students receiving OSS are coded as expulsion The number of days assigned for in-school and out-of- school suspensions are duplicative. One incident 3 infractions Insubordination Fighting Tobacco Action Taken OSS for three days Number of days entered 9 3 per infraction What should have been entered? One day per infraction totaling 3 days Data Quality and eSchool
ISSUE: You have moles in your yard and they are tunneling, creating holes, and tearing up your landscape. How do you get rid of them? What do you know about Moles? Why is your yard interesting to moles? What strategies would you implement to rid you yard of moles? Root Cause & Moles Kill the moles Pour chemicals down the holes to kill the moles Blow up the holes like in Caddy Shack Fill the holes with water Repel the moles with Mothballs Caster Oil Peppermint Ultrasonic solar garden stakes What else???
Next Steps and TimeLine One month to finish rubric and plans in Excel. Email the completed Rubric in Excel to jafields@ualr.edu by May 1, 2018. What is Next? Letters notifying the districts of their disproportionate identification and the required review of policies, procedures, and practices will be sent in the next two weeks.