Analyzing Trends in Student Placement for Autism and Intellectual Disability in California
Explore the project's goal of examining trends and factors influencing the placement of students with autism and intellectual disability in California over a 5-year period. Data obtained from the California Department of Education underwent complex data organization to build an analyzable dataset. Methodology involved logistic regression analysis and data visualization to understand placement patterns.
- Student placement
- Autism
- Intellectual disability
- California Department of Education
- Logistic regression analysis

Download Presentation

Please find below an Image/Link to download the presentation.
The content on the website is provided AS IS for your information and personal use only. It may not be sold, licensed, or shared on other websites without obtaining consent from the author. Download presentation by click this link. If you encounter any issues during the download, it is possible that the publisher has removed the file from their server.
E N D
Presentation Transcript
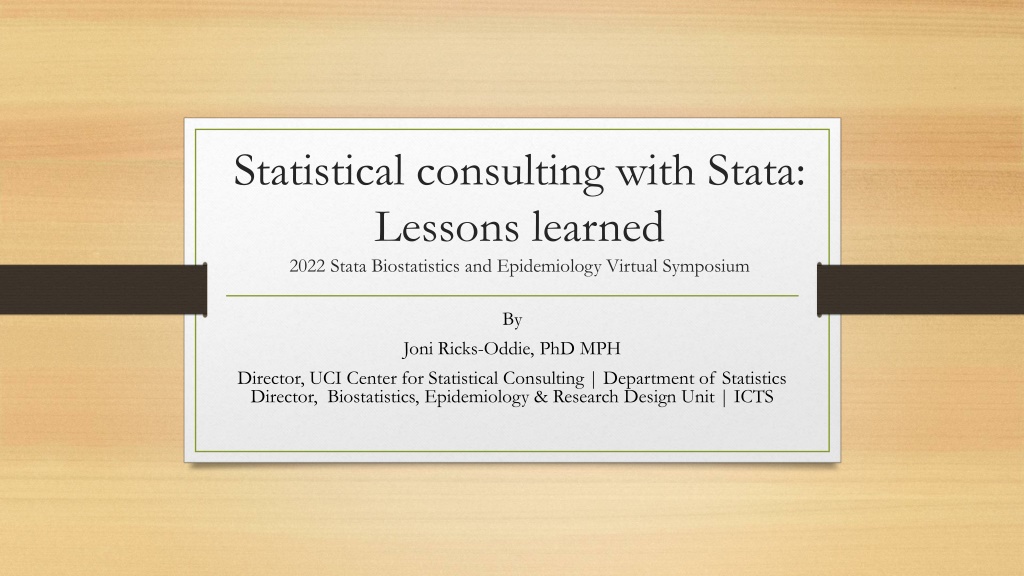
Statistical consulting with Stata: Lessons learned 2022 Stata Biostatistics and Epidemiology Virtual Symposium By Joni Ricks-Oddie, PhD MPH Director, UCI Center for Statistical Consulting | Department of Statistics Director, Biostatistics, Epidemiology & Research Design Unit | ICTS
Whats so great about Stata Software we use Stata R SAS SPSS Mplus Prism Why Stata Ease of use Syntax Consistency Flexibility Documentation
Example 1 Where Are Students with Autism and Intellectual Disability Learning?: Placement Trends in California. Inclusion
Project Overview Project Goal To examine variability in placement of students with autism and intellectual disability in order to explore factors associated with placement into regular classroom settings Specific Research Questions: What are the trends in placement of students with autism and ID over a 5-year period? What is the relationship between placement of students with autism and ID and selected demographic factors: 1. percentage of students receiving free or reduced-price lunch (district socioeconomic status) 2. number of K-12 students in the district (district size) 3. district per pupil expenditure (district expenditure) 4. percentage of students with disabilities in each district by race/ ethnicity ?
Methodology Data Data were obtained from the California Department of Education (CADOE) via a formal data request. 2 level data School and School District All data were from the CADOE, but clearly not all from the same sources. Complications CA Dept of Educations data was organized in multiple spread sheets with out a clear linking variable We had to build an analyzable dataset from multiple excel sheets Changes in the reported methods across time
Analysis Outcome Proportion of students placed in a specific classroom setting Chose a Logistic regressions that clustered by school district Other options: Poisson with an offset Multilevel model Data Visualization Used margins and margins plot Estimate and graph predicting probability of placement across time
Comparing graphs side by side Note the downward shift in predicted probabilities when moving from 2016 to 2017 This could be indicative of some sort of policy change and/or change in reporting standards
Example 2 Comparison of NSQIP- SRC, TRISS, and ASA-PS to Predict Operative Trauma Mortality in Elderly Patients
Project Overview Project Goal Evaluate the utility of several trauma-specific risk calculators in an elderly population Specific Research Questions: Explore the predictive ability of NSQIP-SRC, TRISS, and ASA-PS scoring systems in elderly operative trauma patients.
Methodology Data Observational data Multicenter study, data Adult trauma patients requiring surgery within 24 hours of admission Planned subgroup analysis of elderly patients 65 years or older Complications External validation on a small sample Large number of comorbidities used in risk calculators
Analysis Outcomes Mortality (binary), Length of Stay (count) and Number of Complications (count) Chose to use a Firth Logit, Linear Regression and Negative Binomial Other options: Binary Logistic (separation issues), Poisson (over dispersed) We used a series of commands in Stata to assess the prediction quality of each risk calculator
Data Visualization Used the roccomp to test the equality of ROC areas Quick and easy way to make the comparisons you want with the correct number of degrees of freedom You can specify your own set of matrices to tailor the comparison you want to make between ROC area
Mean probability of outcome 0.0453 of forecast 0.0471 Correlation 0.3800 Brier Score ROC area 0.8856 p = 0.0000 Brier score 0.0370 Definition- Proper score function or strictly proper scoring rule that measures the accuracy of probabilistic prediction Spiegelhalter's z-statistic -0.3732 p = 0.6455 Sanders-modified Brier score 0.0370 Sanders resolution 0.0370 Outcome index variance 0.0433 Command = brier Computes the Yates, Sanders, and Murphy decompositions of the Brier mean probability score. Murphy resolution 0.0063 Reliability-in-the-small 0.0000 Forecast variance 0.0064 Excess forecast variance 0.0055 The Brier score is a measure of disagreement between the observed outcome and a forecast (prediction). Minimum forecast variance 0.0009 Reliability-in-the-large 0.0000 2*Forecast-Outcome-Covar 0.0127 Documentation provides a nice explanation of the metrics provided and their appropriate use
Calibration plot of prediction model performance Command = pmcalplot (user-written) Works with Binary, Survival and linear regression models Produces a calibration plot of observed against expected probabilities for assessment of prediction model performance Primarily useful for assessment of model performance in an external validation of an existing model.
Example 3 - Cognitive Function during the Prodromal Stage of Alzheimer's Disease in Down Syndrome: Comparing Models
Project Overview Project Goal Explore how the sequence of cognitive decline in adults with Down Syndrome (DS) and early stage Alzheimer's Disease (AD) Complicating early detection of AD progression and diagnostic accuracy is the large variability in baseline cognitive ability among people with DS Specific Research Questions: Examine AD-related clinical status is associated with multiple measures of cognitive impairment
Methodology Data 144 adults with Down Syndrome Subgroup of larger study cohort examining biomarkers of AD in adults with DS. Examined 2 groups: 1. Cognitively Stable (CS(, AD-related impairment was absent 2. MCI-DS, indicating that there was some indication of cognitive and/or functional decline Complications Small sample Twenty-two measures from 13 instruments were hypothesized a priori to measure four cognitive domains: (1) executive function, (2) language, (3) memory, and (4) visuomotor: 17 measures cognitive impairment derived from 10 tests of cognition
Analysis Twenty-two measures from 13 instruments were hypothesized a priori to measure four cognitive domains: (1) executive function, (2) language, (3) memory, and (4) visuomotor: Considered other methods for evaluating domains Composite Scores CFA SEM EFA using all 22 measures to assess the hypothesized domain structure The resulting structure was then used in a Structural Equations Model
Exploratory Factor Analysis Command = efa An initial set of analyses considered 22 scores, but results revealed problems with the five variables ranging from weak loadings, to high uniqueness or significant cross-loadings that did make theoretical sense. These 5 variables were not included in the overall SEM. The original four cognitive domains: (1) executive function, (2) language, (3) memory, and (4) visuomotor: We ended up 3 factors representing (1) language/executive function, (2) memory, and (3) visuomotor that made theoretical sense to the researcher
Client and Staff Training Command = sem Well documented and includes a good amount of theory Syntax is clear and straightforward Stata is a great tool for learning to perform SEM The staff member I had working on this project has never performed SEM The clinical we were working with all had no experience with SEM I used the project as a training tool for both Difficult software or syntax can make training on the theory difficult
Conclusions While we use a variety of software, Stata is a main work horse for our units The syntax consistency make it easy for new staff to pick up Offers data management and analytic methods that cover a hosts of disciplines It is often a recommendation I make to research transitioning out of SPSS There is a lot of interest