Understanding Data Mining: Techniques and Applications in Modern Business

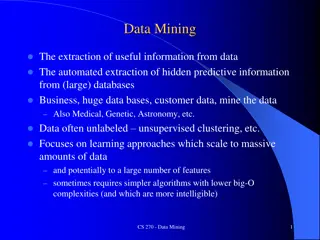
Data mining involves the extraction of valuable insights from large datasets to improve business processes. It enables the discovery of patterns and correlations that can lead to informed decision-making in the rapidly evolving business landscape.

Download Presentation

Please find below an Image/Link to download the presentation.
The content on the website is provided AS IS for your information and personal use only. It may not be sold, licensed, or shared on other websites without obtaining consent from the author. Download presentation by click this link. If you encounter any issues during the download, it is possible that the publisher has removed the file from their server.
E N D
Presentation Transcript
What is Data Mining? Data Mining Motivation Data Mining Applications Applications of Data Mining in CRM Data Mining Taxonomy Data Mining Techniques 2
The non-trivial extraction of novel, implicit, and actionable knowledge from large datasets. Extremely large datasets Discovery of the non-obvious Useful knowledge that can improve processes Can not be done manually Technology to enable data exploration, data analysis, and data visualization of very large databases at a high level of abstraction, without a specific hypothesis in mind. Sophisticated data search capability that uses statistical algorithms to discover patterns and correlations in data. 3
Data Mining is a step of Knowledge Discovery in Databases (KDD) Process Data Warehousing Data Selection Data Preprocessing Data Transformation Data Mining Interpretation/Evaluation Data Mining is sometimes referred to as KDD and DM and KDD tend to be used as synonyms 5
Data warehousing SQL / Ad Hoc Queries / Reporting Software Agents Online Analytical Processing (OLAP) Data Visualization 7
Changes in the Business Environment Customers becoming more demanding Markets are saturated Databases today are huge: More than 1,000,000 entities/records/rows From 10 to 10,000 fields/attributes/variables Gigabytes and terabytes Databases are growing at an unprecedented rate Decisions must be made rapidly Decisions must be made with maximum knowledge 8
The key in business is to know something that nobody else knows. Ari Onassis PHOTO: LUCINDA DOUGLAS-MENZIES PHOTO: HULTON-DEUTSCH COLL To understand is to perceive patterns. Sir Isaiah Berlin 9
Performing basket analysis Which items customers tend to purchase together. This knowledge can improve stocking, store layout strategies, and promotions. Sales forecasting Examining time-based patterns helps retailers make stocking decisions. If a customer purchases an item today, when are they likely to purchase a complementary item? Database marketing Retailers can develop profiles of customers with certain behaviors, for example, those who purchase designer labels clothing or those who attend sales. This information can be used to focus cost effective promotions. Merchandise planning and allocation When retailers add new stores, they can improve merchandise planning and allocation by examining patterns in stores with similar demographic characteristics. Retailers can also use data mining to determine the ideal layout for a specific store. 11
Card marketing By identifying customer segments, card issuers and acquirers can improve profitability with more effective acquisition and retention programs, targeted product development, and customized pricing. Cardholder pricing and profitability Card issuers can take advantage of data mining technology to price their products so as to maximize profit and minimize loss of customers. Includes risk-based pricing. Fraud detection Fraud is extremely costly. By analyzing past transactions that were later determined to be fraudulent, banks can identify patterns. Predictive life-cycle management DM helps banks predict each customer s lifetime value and to service each segment appropriately (for example, offering special deals and discounts). 12
Call detail record analysis Telecommunication companies accumulate detailed call records. By identifying customer segments with similar use patterns, the companies can develop attractive pricing and feature promotions. Customer loyalty Some customers repeatedly switch providers, or churn , to take advantage of attractive incentives by competing companies. The companies can use DM to identify the characteristics of customers who are likely to remain loyal once they switch, thus enabling the companies to target their spending on customers who will produce the most profit. 13
Customer segmentation All industries can take advantage of DM to discover discrete segments in their customer bases by considering additional variables beyond traditional analysis. Manufacturing Through choice boards, manufacturers are beginning to customize products for customers; therefore they must be able to predict which features should be bundled to meet customer demand. Warranties Manufacturers need to predict the number of customers who will submit warranty claims and the average cost of those claims. Frequent flier incentives Airlines can identify groups of customers that can be given incentives to fly more. 14
Customer Life Cycle The stages in the relationship between a customer and a business Key stages in the customer lifecycle Prospects: people who are not yet customers but are in the target market Responders:prospects who show an interest in a product or service Active Customers: people who are currently using the product or service Former Customers:may be bad customers who did not pay their bills or who incurred high costs It s important to know life cycle events (e.g. retirement) 15
What marketers want: Increasing customer revenue and customer profitability Up-sell Cross-sell Keeping the customers for a longer period of time Solution: Applying data mining 16
DM helps to Determine the behavior surrounding a particular lifecycle event Find other people in similar life stages and determine which customers are following similar behavior patterns 17
Data Warehouse Data Mining Customer Profile Customer Life Cycle Info. Campaign Management 18
Data Mining Techniques Descriptive Predictive Clustering Classification Association Decision Tree Sequential Analysis Rule Induction Neural Networks Nearest Neighbor Classification Regression 19
Honest John Vickie Mike Crooked Barney Wally Waldo 20
John Vickie Mike Honest = has round eyes and a smile 21
Data height short tall tall short tall tall tall short hair blond blond red dark dark blond dark blond eyes blue brown blue blue blue blue brown brown class A B A B B A B B 22
hair dark blond red short, blue = B tall, blue = B tall, brown= B short, blue = A tall, brown = B tall, blue = A short, brown = B {tall, blue = A} Does not completely classify blonde-haired people. More work is required Completely classifies dark-haired and red-haired people 23
hair dark blond red short, blue = B tall, blue = B tall, brown= B short, blue = A tall, brown = B tall, blue = A short, brown = B {tall, blue = A} Decision tree is complete because 1. All 8 cases appear at nodes 2. At each node, all cases are in the same class (A or B) eye blue brown short = A tall = A tall = B short = B 24
hair dark blond red B A eyes blue brown A B 25
Try to find rules of the form IF <left-hand-side> THEN <right-hand-side> This is the reverse of a rule-based agent, where the rules are given and the agent must act. Here the actions are given and we have to discover the rules! Prevalence = probability that LHS and RHS occur together (sometimes called support factor, leverage or lift ) Predictability = probability of RHS given LHS (sometimes called confidence or strength ) 26
Association Rules from Market Basket Analysis <Dairy-Milk-Refrigerated> <Soft Drinks Carbonated> prevalence = 4.99%, predictability = 22.89% <Dry Dinners - Pasta> <Soup-Canned> prevalence = 0.94%, predictability = 28.14% <Dry Dinners - Pasta> <Cereal - Ready to Eat> prevalence = 1.36%, predictability = 41.02% <Cheese Slices > <Cereal - Ready to Eat> prevalence = 1.16%, predictability = 38.01% 27
Use of Rule Associations Coupons, discounts Don t give discounts on 2 items that are frequently bought together. Use the discount on 1 to pull the other Product placement Offer correlated products to the customer at the same time. Increases sales Timing of cross-marketing Send camcorder offer to VCR purchasers 2-3 months after VCR purchase Discovery of patterns People who bought X, Y and Z (but not any pair) bought W over half the time 28
The art of finding groups in data Objective: gather items from a database into sets according to (unknown) common characteristics Much more difficult than classification since the classes are not known in advance (no training) Technique: unsupervised learning 29