Contaminant Levels in Alaskan Populations and Marine Mammals

The content discusses the presence of contaminants in Alaskan populations and marine mammals, highlighting factors influencing contaminant levels, variations based on species, tissues, age, and sex, as well as potential risks associated with elevated body burdens. It emphasizes the importance of considering specific chemicals for risk assessment purposes and points out variations in contaminant concentrations within different tissues and animals.

Download Presentation

Please find below an Image/Link to download the presentation.
The content on the website is provided AS IS for your information and personal use only. It may not be sold, licensed, or shared on other websites without obtaining consent from the author. Download presentation by click this link. If you encounter any issues during the download, it is possible that the publisher has removed the file from their server.
E N D
Presentation Transcript
Contaminant Levels in Alaskan Populations and Marine Mammals
Talking Points Which chemicals should we consider for RSC or at all? See white paper distributed by Brock Which chemicals are relevant to Alaska? E.g. In the U.S. all uses of toxaphene were banned in 1990 Which ones do not have an RfD E.g. p-DDE has an oral cancer slope factor but no RfD PCBs have a CSF but only some Aroclor mixtures have an RfD Contaminants levels can be elevated in MM tissues What species/tissues are the most consumed? Alaska populations consuming marine mammals can show elevated body burdens of contaminants They may be exposed to levels considered unsafe How does the concept of RSC apply to these populations?
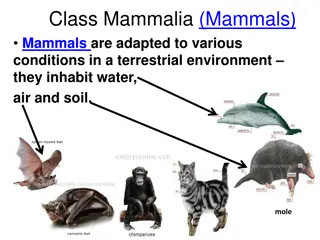
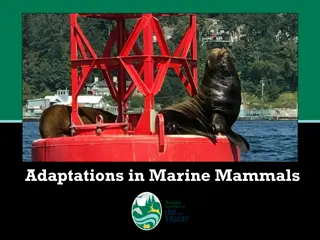
CONTAMINANTS LEVELS IN MARINE MAMMALS
Contaminants in MM tissues Many contaminant have been measured in MM tissues: Cadmium Mercury Cis-Chlordane Oxy-chlordane Heptachlor Heptachlor epoxide HCB HCH PFCs PBDEs PCBs DDTs (PAHs in clams?) Levels are variable depending on Location/habitat Species Age, sex, tissue type
Concentrations Variations with Animals Sex Male to Female Ratio for some Contaminants Concentrations in Beluga Whale Tissues 1.2 Male 1 Female 0.8 0.6 0.4 0.2 0 Generally, males seem to accumulate higher contaminant levels Limitation: No age information Hoguet et al. 2013, Krahn et al. 1999
Concentrations Variations with Animals Age Mercury in Harbor Seal Liver and Heart 120 100 80 Liver Hg Levels (ppm ww) 60 40 20 0 0 2 4 6 8 10 12 14 16 18 Animal Age (yrs) Female Harbour Seals_PWS_Liver Male Harbour Seal_PWS_Liver Female Harbour Seal_Kodiak_Liver Male Harbour Seal_Kodiak_Liver
Concentrations Variations with Tissue Type Mercury in Harbor Seal liver and heart Seals were from Kodiak and Prince William Sounds Heart Liver 2 orders of magnitude 120 1.2 1 100 0.8 80 ppm ww ppm ww 0.6 60 0.4 40 N=80 N=38 N=17 0.2 20 0 0 Heart PWS Liver PWS Liver Kodiak Marino et al. 2011
PCB Residues in Domestic Raw Foods for Fiscal Years 1969 1976 ATSDR. 2000. PCB Toxicological Profile
Concentrations Variations with Tissue Type Median PCB Levels in Bowhead Whale Tissues (n=5) FDA s Tolerance Level in Fish = 2 ppm (0.2-3.0 ppm PCBs for all other foods) 350 Fish from previous slide ~ 900 ppb 300 250 PCBs (ppb w.w.) 200 150 100 Shellfish from previous slide 50 0 Hoekstrsa et al. 2005, O'Hara 2005
Concentrations Variations with Species Median PCB Levels in MM from Various Locations 6000 5000 [PCB] (ppb ww) 4000 3000 FDA s Tolerance Level in Fish 2000 1000 0 Cook Inlet Cook Inlet Point Lay Point Lay Point Lay Barrow Barrow Barrow Bering Bering Sea Bering Sea Sea Beluga Bowhead Whale Pacific Walrus Ringed Seal Bearded Seal N=10,10, 11, 8, 20 N= 7 N= 6, 14, 10 N=14, 12, 25 N= 5, 3, 20 Krahn et al. 1999, Hoekstra et al. 2003, o'Hara et al. 1999, Seagars et al. 2000, Struntz t al. 2000, Kuckllick et al. 2002
HUMAN EXPOSURE TO CONTAMINANTS
Exposure of Arctic Populations Arctic populations generally show higher levels of persistent contaminants than people from lower latitudes Contribution of their subsistence diet Levels vary with age, sex, location
Subsistence in Alaska From Alaska Department of Fish and game, Division of Subsistence. 2014. Subsistence in Alaska: A Year 2012 Update
Mean Pesticide Levels by Age in 5 Aleutian and Pribilof Villages, AK 1999 Comparison with NHANES ( 99- 00) Most pesticides were not detected in NHANES subjects - Sample size ~ 600-700 for each age category NHANES 1999-2000, Geo Mean (ppb) 12-19 y.o. >20 y.o. -HCH ND 0.087 Heptachlor Epoxide ND ND Oxychlordane ND ND (12.9 in 01-02) t-Nonachlor ND 20.8 p,p -DDE 118 287 Dieldrin ND ND p,p -DDT ND ND Mirex ND ND
Blood Mercury in Alaska Native women* vs. NHANES III 7 6.6 6 *Berner 2005 Blood Mercury (ug/L) 5 4 3 Today about 0.7ppb 2 0.83 1 0 Alaska Native Women n = 205 U.S. women - CDC NHANES III n = 1928
Hair Mercury Levels Subsistence v non-subsistence diet 4 3.5 3 Hair Hg (ppb) 2.5 2 16 1.5 1 20 0.5 0 Fairbanks Napakia Yup'ik Mean hair mercury level in subsistence food users is 7.6-fold the level of their non-subsistence counterpart 1.45 ppm (Range:0.32-4.00 ppm) v 0.19 ppm (Range: 0.03 to 0.43 ppm) Rothschild, 2002
Aleutian/Pribilof WCBA and AMAP maternal plasma, 1994-1996 600 Aleu/Prib Canada Greenland Sweden Norway Iceland Russia 500 G. Mean, ppb lipid 400 300 200 100 0 PCBs p,p'-DDE
Median PCB Levels by Age and Sex 3000 8 2500 Male Female 5 2000 PCBs, ppb lipid 9 17 1500 14 4 12 1000 19 21 25 500 13 9 4 6 0 18-24 25-34 35-44 45-54 55-64 65-74 75-91 Age (Years)
Infant Exposure Through Breastmilk Infants can be a significantly exposed to POPs through breast milk BDE-47 (A) and PCB-153 (B) levels in breast milk collected 6 24 weeks after birth. Hooper et al. 2007
DIETARY INTAKE (PCBs and Mercury)
Estimated Daily Dietary Intake of PCBs in the US Dietary intake ( g/kg body weight per day) Year Adult Toddler Infants 1986 1991 <0.001 0.002 <0.001 1982 1984 0.0005 0.0008 0.0012 1981 1982 0.003 ND ND 1980 0.008 ND ND 1979 0.014 ND ND 1978 0.027 0.099 0.011 1977 0.016 0.030 0.025 1976 Trace ND Trace ATSDR (2000). Estimated intakes are based on an average "total diet" composition (which varies slightly) and not on individual food items. Average body weights are assumed to be 9 kg for infants, 13 kg for toddlers, and 70 kg for adults. Accordingly, the average dietary intake for 1982 1984 would be 0.0108 g, 0.0104 g, and 0.035 g for the infant, toddler, and adult, respectively.
Safe PCB Health Criteria Agency Value Comment FDA 0.2-3.0 ppm (all foods) 2.0 ppm (fish) Tolerance Level WHO FAO 6.0 g/kg per day 12.8 mg/month/person Allowable daily intake EPA - IRIS CSF = 2.0 per (mg/kg)/day Upper bound of the Oral CSF for high persistence PCBs [Central estimate is 1/(mg/kg/d)] EPA - IRIS RfDs Developed for Aroclor 1016, Aroclor 1248, and Aroclor 1254 ATSDR Chronic MRL = 0.02 g/kg/d Aroclor 1254
Health Risks Associated with a Consumption of 6 oz/d? 6000 Beluga Bowhead Whale Pacific Walrus Median PCB Levels 5000 [PCB] (ppb ww) 4000 Cancer risk of 10-2 3000 2000 FDA s Tolerance Level in Fish 1000 0 Cook Inlet Cook Inlet Point Lay Point Lay Point Lay Barrow Barrow Barrow Bering Bering Sea Bering Sea Sea For a 6 oz daily consumption (70 kg adult) Cancer risk < 10-4 for a tissue concentration < 20 ppb ww The MRL will be exceeded for a concentration > 8 ppb (Assuming 100% Aroclor 1254)
Acceptable Mercury Dose Harbor Seal Liver Acceptable Hg intake: 0.4 g/kg BW/d For a 70 kg adult 28 g/d Median [Hg] in PWS Liver: 8 g/g Safe consumption 3.5 g/d 120 100 80 ppm ww 60 106 g/month 3.7 oz/month 40 20 0 Liver PWS Liver Kodiak ~ 4 oz/month is likely exceeded
Conclusion / Questions In marine mammals, contaminant concentrations Can be elevated Vary widely with species, age and especially tissue type The concept of trophic level is insufficient to characterize accumulation in MM How to reconciliate this with the concept of RSC? How to deal with the large variability observed within species? Because of their subsistence life style, Arctic populations tend to be more exposed to contaminants than the general population They might be regularly exposed to some chemicals at levels exceeding what is considered safe How does the RSC apply?