Childhood Obesity Trends and Data Analysis in Southampton

Childhood obesity data analysis reveals an increase in obesity and excess weight prevalence among Year R and Year 6 children in Southampton for the 2020/21 academic year. While Year R data shows a significant rise compared to previous years, Year 6 data was not robust for statistical comparisons. Sex differences also indicate higher overweight and obesity rates in males. The analysis highlights the need for targeted interventions to address the growing obesity problem among children in Southampton.

Download Presentation

Please find below an Image/Link to download the presentation.
The content on the website is provided AS IS for your information and personal use only. It may not be sold, licensed, or shared on other websites without obtaining consent from the author. Download presentation by click this link. If you encounter any issues during the download, it is possible that the publisher has removed the file from their server.
E N D
Presentation Transcript
I Childhood obesity task and finish group May 2022 Southampton City Council Southampton City Council
Latest 2020/21 national child measurement data set I Dataset was release was delayed from mid-November 2021 to 12th January 2022 52% of Year R children and 12% of Year 6 children were measured in 2020/21 in Southampton Schools Recommended checks andbalances carried out on data to see if smaller sample was representative of previous years and trends in changes in birth data by ethnic group before analysis Year R data was evaluated as a robust sample for analysis as a single year (trends and deprivation) Year 6 data was evaluated as indicative but not robust for analysis as a single year
Year R data I Between 2016/17 and 2019/20 level of childhood obesity and excess weight for reception year children locally and nationally have largely remained at statistically similar levels*. *(Except for in 2017/18 Southampton had a significantly higher level than the national average for Year R obesity) Latest data for 2020/21 shows a significantly higher increase for obesity and excess weight prevalence in year R locally and nationally compared to the previous four years. The prevalence of obesity and excess weight for Southampton year R children is significantly higher than nationally levels whereas previously it was similar. 2020/21 England - Year R: Southampton - Year R: Obese 14.4% Obese 17.1% Excess Weight 27.7% Excess Weight 32.7%
Year 6 data 2020/21 sample data NOT robust for statistical comparisons I The Year 6 2020/21 sample for Southampton was too small to make robust statistical comparisons However the prevalence for Year 6 obesity (26%) and excess weight (41%) mirrors the national figures and increasing prevalence in the trend data follows the national direction of travel. 2020/21 England - Year R: Southampton - Year R: Obese 25.5% Obese 26.5% Excess Weight 40.9% Excess Weight 41.0%
Sex differences I Year R 2018/19 to 2020/21 Year 6 Overweight including obese Overweight including obese % Point gap 0.7% Statistically similar % Point gap 7.3% Males significantly higher 25.2% 25.9% 40.5% 33.2% Obese Obese % Point gap 0.2% Statistically similar % Point gap 6.2% Males significantly higher 11.8% 12.0% 26.5% 20.3% There is a statistically significant difference between prevalence by gender for Year 6
I Linked analysis Southampton children Southampton children in Year R 2012/13 to 2014/15 3,600 linked records by NHS Number of the SAME children Southampton children in Year 6 2018/19 to 2020/21 0.9% 1.4% Underweight 76.3% 61.9% Healthy weight 13.2% Overweight 12.8% 23.4% Obese 10.0%
Linked analysis changes in weight status in Southampton I Year R 2012/13 to 2014/15 Year 6 2018/19 to 2020/21 Overweight 20.0% Healthy weight 32.3% Obese 47.5% Of the 12.8% of children who were OVERWEIGHT in Year R Almost half of overweight children in year R become obese by Year 6, whilst a fifth had remained overweight, although 32% had become a healthy weight Overweight 12.2% Healthy weight 10.3% Obese 77.5% Of the 10.0% of children who were OBESE in Year R Over three-quarters (78%) of obese children were still obese in Year 6, only a tenth had become a healthy weight by Year 6 (10%) Year R obesity is a clear predictive factor for obesity in Year 6. However
Linked analysis changes in weight status in Southampton I Year R 2012/13 to 2014/15 Year 6 2018/19 to 2020/21 Obese 9.3% Overweight 19.4% Healthy weight 71.4% Of the 13.2% of children who were OVERWEIGHT in Year 6 The majority of overweight children in year 6 had been healthy weight in reception, whilst just below a fifth had remained overweight and a further 9% had been obese Overweight 26.0% Healthy weight 40.9% Obese 33.1% Of the 23.4% of children who were OBESE in Year 6 Over two-thirds (67%) of obese children had not been obese in reception, in fact the biggest proportion was for those who had been healthy weight (41%) So although Year R obesity is a predictive factor for obesity in Year 6, interventions targeted only at this cohort only have the potential to reduce Year 6 obesity by one third.
Year R overweight (incl. obese) deprivation I Excess weight in reception children children statistically significantly more prevalent in the most deprived quintile (27.7%) than the least deprived quintile (18.6%) (2018/19 to 2020/21 pooled) Gap between children in the most and least deprived parts of Southampton has widened more recently The proportion of reception children classified with excess weight in the most deprived quintile has increased, whereas that proportion living in less deprived areas appears to have fallen and remained lower
Year 6 overweight (incl. obese) deprivation I Excess weight in Year 6 children statistically significantly more prevalent in the most deprived quintile (41.4%) than the least deprived quintile (25.6%) (2018/19 to 2020/21 pooled) Gap between children in the most and least deprived parts of Southampton has widened more recently The proportion of Year 6 children classified with excess weight in the most deprived quintile has slowly risen, whereas that proportion living in less deprived areas has fluctuated then decreased overall
Linked analysis changes in weight status in Southampton I Year R 2012/13 to 2014/15 Year 6 2018/19 to 2020/21 Overweight 20.0% Healthy weight 32.3% Obese 47.5% Of the 12.8% of children who were OVERWEIGHT in Year R Total Overweight 14.4% Healthy weight 31.3% Obese 54.4% Of the 14.0% of children who were OVERWEIGHT in Year R 20% most deprived Overweight 21.4% Healthy weight 42.9% Obese 35.7% Of the 12.8% of children who were OVERWEIGHT in Year R 20% least deprived
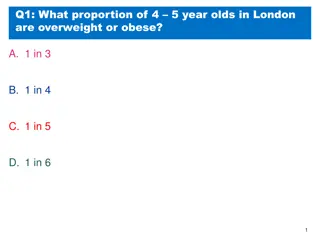
Key messages I Between 2016/17 and 2019/20, 1 in 10 reception year children in England and Southampton were measured to be obese In 2020/21, this rose to 1 in 7 reception children nationally and 1 in 6 Southampton reception year children Statistical tests show the increase this recent year compared to previous years is a statistically higher increase. Also for 2020/21, comparing Southampton with national figures, obesity levels in Southampton reception year children is significantly higher than England. Analysis by deprivation has shown the inequality gap to be widening further for children living in the most deprived areas locally and nationally. Year 6 data mirrors the national figures and increasing prevalence in the trend data follows the national direction of travel, although the reduced cohort means robust comparisons can t be made Linked analysis continues to show obesity in Year R is a strong predictive factor for obesity in Year 6, however . Only a third of obese children in Year 6 were previously obese in Year R (with 40% previously a healthy weight), so any interventions need to not only focus on obese children to avoid limited impact


 deprivation")
 deprivation")