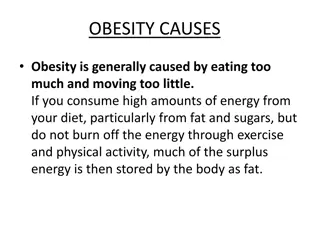
UK's Sugar Reduction and Childhood Obesity Programmes
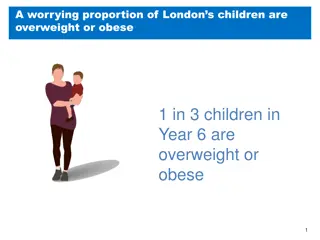
Public Health England's Deputy Director of Diet and Obesity, Alison Tedstone, leads the UK's efforts to reduce sugar intake and combat childhood obesity. The prevalence of excess weight and tooth decay among children is highlighted, along with comparisons of UK diets with nutritional recommendations and the impact of calorie overconsumption on overweight and obese children. The National Child Measurement Programme data reveals the status of child obesity in the UK. Stakeholder briefings emphasize the importance of sugar reduction in achieving health goals.

Download Presentation

Please find below an Image/Link to download the presentation.
The content on the website is provided AS IS for your information and personal use only. It may not be sold, licensed, or shared on other websites without obtaining consent from the author. Download presentation by click this link. If you encounter any issues during the download, it is possible that the publisher has removed the file from their server.
E N D
Presentation Transcript
UKs Sugar reduction and wider reformulation programme Alison Tedstone Deputy Director Diet and Obesity / Chief Nutritionist Public Health England March 2018
Prevalence of excess weight and tooth decay among children The difference in obesity prevalence between boys and girls was larger in year 6 than reception. Reception Underweight prevalence was higher for boys in reception but higher for girls in year 6. Year 6 18.1 9.2 Girls Girls 14.3 12.9 0.7 1.5 10.0 21.8 Boys Boys 13.1 14.3 1.2 1.2 0 2 4 6 8 10 12 14 0 5 10 15 20 25 Underweight | Overweight | Obese Underweight | Overweight | Obese The proportion of children in the healthy weight category is not shown as it would lengthen the scale making the differences for the other categories harder to see. For more information: Table 1a National Child Measurement Programme, England, 2016/17 school year. In 2015 25% of children aged 5 years had tooth decay In 2013 46% of children aged 8 years 34% of children aged 12 years 46% of children aged 15 years Data from 2015/2013 dental health surveys 2
UK diet compared with recommendations Children 4-10 yrs Teenagers 11-18 yrs 33.9 12.4 0.5 Adults 19-64 yrs Nutrient Recommendation 35% food energy 11% food energy 2% food energy 33.4 13 0.5 34.7 12.5 0.5 Total fat Saturated fat Trans fat Total carbohydrate 50% food energy 5% total energy 51.6 50.5 47.6 Free sugars 13.5 14.1 11.1 Fibre (AOAC) 2-4 yrs 15g 5-10 yrs 20g 11-15 yrs 25g 16+ yrs 30g 14.0 15.3 19.0 Salt 4-6 yrs 3g 7-10yrs 5g 11+ yrs 6g 3.9 5.3 7.0 8.0 Sources: National Diet and Nutrition Survey (NDNS) years 7& 8 (2014/15-2015/16) Salt intakes: adults: NDNS: salt intakes in adults 19-64 years in England 2014; children: NDNS: years 1-4 (2008/09-2011/12) 3 Understanding the evidence: early years & school age
Overconsumption of calories On average, compared with those with healthy body weights, overweight and obese children consume between 140 and 500 excess calories per day for boys and 160 and 290 excess calories per day for girls, depending on their age Gender Age Overweight or obese: excess calorie intake 146 498 505 157 229 291 Boys 4 to10 11 to 15 16 to 18 4 to 10 11 to 15 16 to 18 Girls 4 Calorie Reduction
Child overweight and obesity Body Mass Index status of children by age, National Child Measurement Programme 2016/17 5 Calorie reduction
Obesity affects us all 6 Stakeholder briefing: sugar reduction- achieving the 20%
https://www.gov.uk/governmen t/publications/sacn- carbohydrates-and-health- report https://www.gov.uk/governme nt/publications/childhood- obesity-a-plan-for-action https://www.gov.uk/governmen t/publications/sugar-reduction- from-evidence-into-action 7
Sugar reduction: Achieving the 20% Following ten months of engagement, on the 30th March 2017 PHE published technical guidelines for the food industry on sugar reduction. The report sets out: The scope and approach of the programme Guidelines for all of the food industry on total sugar levels in foods and calorie/portion size for single portions An analysis of levels of sugar in key food categories, and soft drinks, for the year 2015 Engagement with industry, non governmental organisations and other stakeholders Key future dates and the next steps in the programme. https://www.gov.uk/government/publica tions/sugar-reduction-achieving-the-20 The programme will also help to reduce health inequalities as sugar consumption, and rates of obesity in children, tend to be highest in the most deprived. 8
Guidelines for industry: principles Overall target is to reduce sugar by 20% by 2020 (5% reduction in year 1) through : A voluntary programme of work giving businesses three methods to reduce the sugar in their products: 1. product reformulation to lower sugar levels present per 100g/ml 2. reduction in the portion size of, and/or the number of calories in, products that are likely to be consumed by an individual at one time. This means less sugar as well as calories and/or fat 3. a shift in consumer purchasing towards lower/no added sugar products The reductions should be accompanied by reductions in calories, where possible, and should not be compensated for by increases in saturated fat. Work to achieve the 2017 salt targets should continue alongside the sugar reduction programme 9
Taking out 20% of sugar in products It applies to all sectors of the food industry i.e. retailers, manufactures and eating out of home sector Category specific sales weighted average targets/100g of product were set for achievement by 2020 In addition calorie or portion size caps were set for single serve products The programme focuses predominantly on reducing the levels of total sugars as they are declared on the nutrition panel of food labels The guidelines have been developed for the top 9 broad food categories contributing to children s (aged up to 18 years) sugar intake: Breakfast cereals Yogurt and fromage frais Biscuits Cakes Morning goods (buns, pastries etc) Sweet spreads and sauces (chocolate spread, peanut butter, dessert toppings/sauces & fruit spreads) Puddings Ice cream, lollies and sorbets Chocolate confectionery Sweet confectionery 10
Soft drinks industry levy Announced March 2016, Finance Bill received Royal Assent in April 2017, comes in to law April 2018 Applies to manufacturers and importers of added sugar soft drinks and across the whole of the UK Pure fruit juices and milk-based drinks are exempt from the levy so become part of PHE s wider reformulation programme The exemption for milk drinks will be reviewed in 2020, taking into account the progress made through voluntary reformulation Two rates based on total sugar content 18p per litre for the lower sugar products (5g/100ml and above) 24p per litre for the higher sugar products (8g/100ml and above) Created an incentive for businesses to reformulate Revenue to be used to support schools including funding for programmes that promote physical activity and balanced diets in school-age children. PHE is including all drinks in its monitoring programme, as requested by HMT 12
Spring 2018 progress report Focus on individual businesses and products in case studies and tables Baseline and Year 1 sales weighted averages for drinks within scope of the Soft Drinks Industry Levy will also be included MCA is supplying data detailing purchases of food and drink that has been consumed out of the home for volume sales for the year ending 31 August 2017; Nutrition data has been collected by MCA from desk and field research in September/October 2017,or provided directly by businesses as of 31 August 2017 13
Calorie reduction: the scope and ambition for action Published March 2018 The calorie reduction programme will account for an additional 19% of children s calorie intakes. Together with the sugar reduction programme and the soft drinks industry levy, this will broadly account for 50% of children s overall calorie intakes Industry s progress will be measured using a similar approach to sugar reduction 14
Calorie reduction ambition 20% reduction in calories by 2024, for foods where there is scope for substantial reformulation and / or portion size reduction Savoury biscuits and crackers Bread with additions (e.g. ciabatta with olives) Cooking sauces, table sauces and dressings Crisps and savoury snacks Egg products Potato products (e.g. chips, prepared mash, etc.) Meat products and processed meats, poultry, fish, meat alternatives, etc. (e.g. pies, pastries, sausages, burgers, etc.) Pasta, rice and noodles, including flavoured and filled varieties Ready meals and meal centres, including takeaways Dips and composite salads (e.g. hummus, coleslaw) Pizza Soups 15 Calorie Reduction
Health economic and other benefits Based on achieving the ambition within 5 years, and outcomes spread over a 25 year period, the calorie reduction programme would: prevent 35,370 premature deaths save the NHS 4.5 billion in healthcare costs save social care costs of around 4.48 billion Assuming the SACN recommendations to reduce sugar intakes to 5% of energy intake are achieved within 10 years, the cost saving to the NHS is estimated to be about 500M per annum by year 10 (due to reductions in the costs associated with dental caries and consequences of obesity). 16 Calorie Reduction
Next steps Two phases of stakeholder engagement to inform the development of guidelines for the main product categories covered by the calorie reduction programme (June/July and Autumn 2018) Publish guidelines for the product categories covered by the programme (mid 2019) Publish progress report on the sugar reduction and wider reformulation programme to include the first detailed assessment of progress on the categories covered by the calorie reduction programme (March 2021) Publish report towards the 20% (mid 2025) The Spring 2018 report will be a detailed report monitoring progress of industry with the sugar reduction programme in Year 1 against the baseline guidelines published in March 2017 17
Alison Tedstone Deputy Director Diet and Obesity / Chief Nutritionist Public Health England March 2018