ITSD Project Status Report - Vendor & Project Overview
This ITSD Project Status Report provides a comprehensive update on the current status of a specific project, including health, scope, deliverables, budget, schedule, resources, stakeholder involvement, issues, risks, completion percentage, on-time completion status, out-of-scope work, milestone statuses, change requests, open issues, open risks, and holiday log. It also includes information on testing status, test completion percentage, mandatory testing status, bugs, outstanding issues, testing resources, and other testing defined in the test plan. The report gives a detailed insight into the project's progress, challenges, and upcoming tasks.
Download Presentation

Please find below an Image/Link to download the presentation.
The content on the website is provided AS IS for your information and personal use only. It may not be sold, licensed, or shared on other websites without obtaining consent from the author. Download presentation by click this link. If you encounter any issues during the download, it is possible that the publisher has removed the file from their server.
E N D
Presentation Transcript
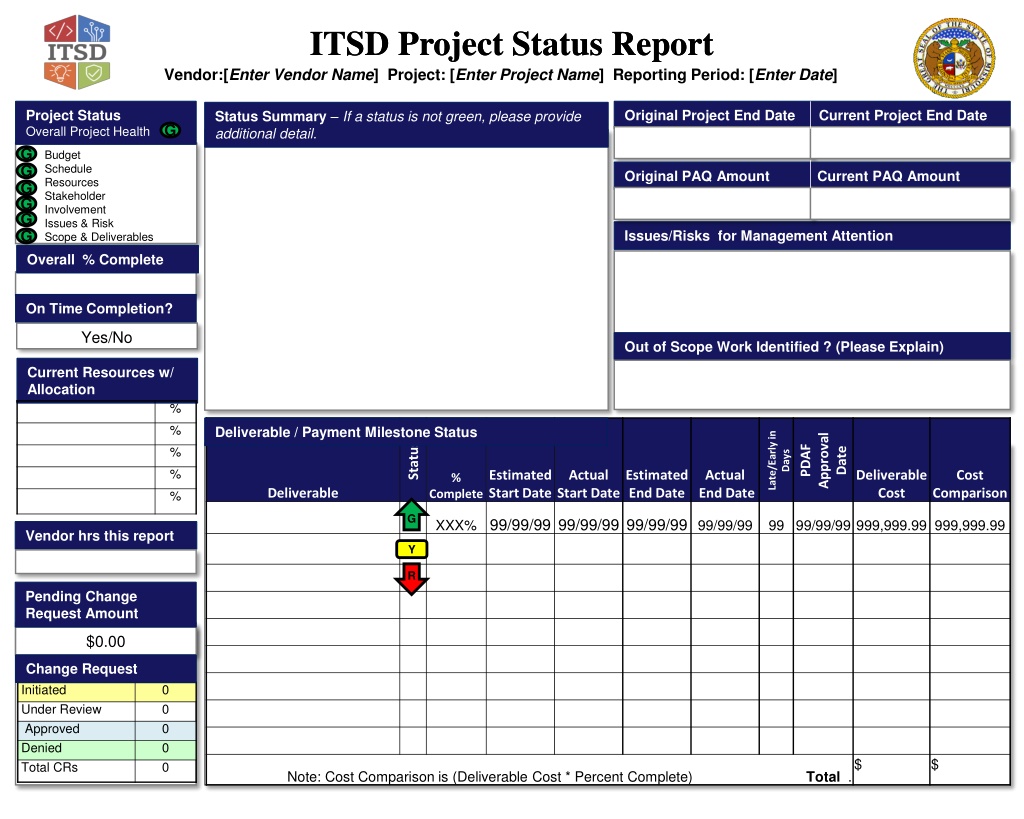
ITSD Project Status Report ITSD Project Status Report Vendor:[Enter Vendor Name] Project: [Enter Project Name] Reporting Period: [Enter Date] Project Status Overall Project Health G G G G G G Scope & Deliverables Original Project End Date Current Project End Date Status Summary If a status is not green, please provide additional detail. G Budget Schedule Resources Stakeholder Involvement Issues & Risk Original PAQ Amount Current PAQ Amount Issues/Risks for Management Attention Overall % Complete On Time Completion? Yes/No Out of Scope Work Identified ? (Please Explain) Current Resources w/ Allocation % % Deliverable / Payment Milestone Status Late/Early in Approval PDAF Status % Date Days % Estimated Start Date Actual Start Date Estimated End Date Actual End Date Deliverable Cost Cost % Deliverable Comparison Complete % G XXX% 99/99/99 99/99/99 99/99/99 99/99/99 99 99/99/99 999,999.99 999,999.99 Vendor hrs this report Y R Pending Change Request Amount $0.00 Change Request Initiated Under Review Approved Denied Total CRs 0 0 0 0 0 Note: Cost Comparison is (Deliverable Cost * Percent Complete) Total .$ $
ITSD Project Status Report ITSD Project Status Report Project Update Tasks Planned for Next Period (Enter Period Beginning and Ending Dates) 9/20/2024 2
ITSD Project Status Report ITSD Project Status Report Open Issues Create Date Close Date ID Status Description Type Priority Assigned To Due Date Problem Resolution Comments Open Risks Create Date Close Date ID Status Description Type Impact Probability Assigned To Mitigation Plan Comments 9/20/2024 3
ITSD Project Status Report ITSD Project Status Report Change Request Log Change Type CR No. Reason Priority Submit Date Submitted By Status Due Date Close Date Impact Action Item Log AI No. Title Description Comments Source Assigned To Date Due 9/20/2024 4 ITSD Project Status Report (Rev 8-2016)
ITSD Project Status Report ITSD Project Status Report Holiday Log Month Date Holiday Name 9/20/2024 5 ITSD Project Status Report (Rev 8-2016)
ITSD Project Status Report ITSD Project Status Report Vendor:[Enter Vendor Name] Project: [Enter Project Name] Reporting Period: [Enter Date] Testing Status Overall Test % Complete % G Mandatory Testing Status Test Cases Bugs % Outstanding Issues Status Test Type Complete Total Completed Passed Failed Resolved Total Resolved Critical G Y R Testing Resources Status of Other Testing Defined in Test Plan ITSD Vendor Business Times Executed Critical Other Information Status Other Test % Complete Score G Y R 9/20/2024 6
ITSD Project Status Report ITSD Project Status Report Instructions Please delete these pages when creating an actual status report. Deliverable and Testing Indicators Green - Expected to complete by Estimated End Date G Yellow - May not be possible to complete by Estimated End Date Y Red - Will not complete by Estimated End Date and decisions are needed R Budget Indicators Green - Expected to complete within budget G Yellow - Additional funding may be required Y Red - Funding decisions are required R Schedule Indicators Green Project completion is expected within the planned schedule G Yellow Project completion may not be possible within the planned schedule Y Red Scheduling decisions are required R Resources Indicators Green - Acceptable involvement and participation of assigned project resources G Yellow Project may be impaired due to limited availability of key staff or skillsets are not adequate Y Red Project completion may not be possible due to absent key staff, changes in key staff, unresponsive staff or lack of required skills. R 9/20/2024 7
ITSD Project Status Report ITSD Project Status Report Instructions Please delete these pages when creating an actual status report. Stakeholder Involvement Indicators Green - Expected to complete by Estimated End Date G Yellow - May not be possible to complete by Estimated End Date Y Red - Will not complete by Estimated End Date and decisions are needed R Issues & Risk Indicators G Green - Minimal impact. Oversight required to help ensure risk remains low. Mitigation potentially not necessary. Yellow - Some disruption. Client might want to consider an alternative approach. Mitigation recommended. Management attention recommended. Y R Red - Major disruption likely. Change in approach required. Mitigation required. Management attention required. Scope & Deliverable Indicators Green Project completion is expected within the planned schedule G Yellow Project completion may not be possible within the planned schedule Y Red Scheduling decisions are required R Overall Project Health Indicators Green - Acceptable involvement and participation of assigned project resources G Yellow Project may be impaired due to limited availability of key staff or skillsets are not adequate Y Red Project completion may not be possible due to absent key staff, changes in key staff, unresponsive staff or lack of required skills. R 9/20/2024 8
ITSD Project Status Report ITSD Project Status Report Risk Probability and Impact Definitions Project managers identify, document, and update risks and issues and track each risk or issue until resolution/acceptance. Project managers use the criteria below to assign levels for risk probability and impact and determining risk severity level. Risk Severity Level Probability 5 (100% Certain) 5 Moderate 10 Moderate 15 Significant 20 Significant 25 Significant 4 (Highly Likely) 4 Minimal 8 Moderate 12 Moderate 16 Significant 20 Significant 3 (Likely) 3 Minimal 6 Moderate 9 Moderate 12 Moderate 15 Significant 2 (Unlikely) 2 Minimal 4 Minimal 6 Moderate 8 Moderate 10 Moderate 1 (Remote) 1 Minimal 2 Minimal 3 Minimal 4 Minimal 5 Moderate Impact 1 Minimal 2 Minor 3 Moderate 4 Significant 5 Severe Probability * Impact = Risk Severity Level 9/20/2024 9
ITSD Project Status Report ITSD Project Status Report Risk Level and Issue Severity Definitions After identifying and rating risks/issues, project managers (and the program director when necessary) will work with senior project leadership and technical teams to decide how to proceed with managing the risks. As seen on the previous slide, issues are defined as a risk with a probability of "5", 100% Certain (because it's happening now). The table below provides recommended courses of action based upon the risk severity level. Risk Value Course of Action Risk Severity Level 15 25 Significant Major disruption likely. Change in approach required. Mitigation required. Management attention required. 5 12 Moderate Some disruption. Client might want to consider an alternative approach. Mitigation recommended. Management attention recommended. 1 4 Minimal Minimal impact. Oversight required to help ensure risk remains low. Mitigation potentially not necessary. For purposes of the monthly/weekly reports, functional areas such as Scope, Schedule, Cost, Quality, and Risks and Issues will assume the color of the highest severity of identified risks/issues monitored in the RAID log.) 9/20/2024 10
