Improving Driver Behavior and Safety Culture Through Telematics at Southern Cross Protection
Southern Cross Protection implemented telematics to address a culture accepting car crashes as part of their business costs. By monitoring driver behavior, they tackled issues like lack of care, pre-engagement driver assessments, and incident reporting. This proactive approach led to significant improvements in safety culture and reduced vehicle incidents.

Download Presentation

Please find below an Image/Link to download the presentation.
The content on the website is provided AS IS for your information and personal use only. It may not be sold, licensed, or shared on other websites without obtaining consent from the author. Download presentation by click this link. If you encounter any issues during the download, it is possible that the publisher has removed the file from their server.
E N D
Presentation Transcript
Southern Cross Protection How telematics can improve driver behavior and safety culture 1
Moderator Jerome Carslake NRSPP Manager ARRB Group P: +61 3 9881 1670 E: jerome.carslake@arrb.com.au 2
Housekeeping Webinar is = 60 mins With questions and discussion throughout . . + = 3
GoTo Webinar functions Please type your questions here 4
Todays presenter Claere is the National Safety Manager at Southern Cross Protection, a position she has held since November 2013. Claere was employed as the company s first safety professional and as part of her initial gap analysis identified vehicle crashes as a significant risk for the company. Since then vehicle safety has remained a major focus in the SXP safety strategy including the use of telematics as a lead indicator of driver safety and a valuable driver monitoring tool. 5
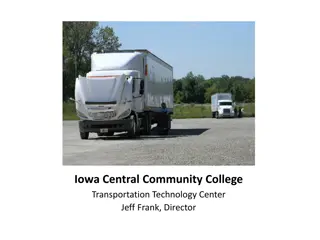
Company Snapshot National Security Firm Night patrols 6 6
Background In 2013 Southern Cross Protection had 83% of it s vehicle fleet damaged in collisions. High direct and indirect costs associated with motor vehicle claims and repairs. Service delivery was being impacted. Speeding infringements were being incurred by individuals on a monthly basis. WHS Manager appointed in December 2013. 7 7
Our Problems The initial gap analysis identified a number of problems. Culture Car crashes were accepted as part of the cost of doing business. Managers belief - these things happen in the security business and we drive our cars 300 kilometers per night so you can t avoid accidents . Lack of care / ownership - Vehicles were observed to be dirty and in poor superficial condition. A very high proportion of incidents were SXP at Fault There was no communication or toolboxing on safe driving behaviours. Security officers were employed even when they had license histories of running red lights or speeding. System Pre-engagement driver assessments were not done. Driver assessment was done using an online system which was not monitored for compliance or ratings. No post vehicle crash investigations were done. Corrective actions were not implemented. There was no observation and feedback process on driving behaviours. Incident reporting and trend analysis was not done. Good driving performance was not recognised or rewarded. 8 8
Safe Driving Program Safe Driving Policy and Procedure developed with support initiatives: 9
Our Early Results 11 11
Using Telematics for Gamification We started with a branch incentive program, the idea was that it would engage drivers and generate team spirit. The branch with the highest average score won and all drivers received $50 gift voucher. We ran this competition twice. Partial success but didn t engage all of the branches branch leadership dictated whether the branch actively participated. An individual driver incentive scheme was then proposed and implemented to drive individual engagement from the floor up. Open to all drivers, contractors and employees Ran over 3 months Average score of 8 or above over 3 months (had to meet baseline kms) with no at fault incidents and no infringements qualified for $100 gift voucher. 12
Results of Individual Driver Incentive Scheme Opti Drive Scheme Number eligible Average Scores % At Fault April 15-1 26 6.27 0.08 July 15-2 28 6.39 1.2 Dec 15-3 32 6.47 1.4 Mar 16-4 57 7 0.07 13
And More Incentives. Following the completion of the 4 back to back driver incentive program we were concerned the incentive would become an entitlement so we decided to re-visit branch competition. The League Ladder was born! 3 June to 9 June 2019 Branch Richmond (Tigers) Regency Park (Redbacks) Darwin (Cyclones) Devonport (Tasmanian Devils) Perth Canberra Keysborough Ipswich CAGE/Electronics (Flash Drives) Sunshine Coast Tweed Heads Coopers Plains Tonsley Park (Titans) Goldcoast Lane Cove (Lions) Newcastle Prestons (Ridgebacks) 91.31 90.14 89.55 Change in telematics providers so scoring change 88.8 87.64 86.83 86.83 85.55 85 84.64 84.44 84.27 83.82 83.68 83 82 81.43 80.8 80.28 North Lakes Tullamarine (Jets) Epping/Thomastown (Thunderbirds) Eagle Farm (Wedgetails) Redlands Average 80.07 77.83 76.14 84.27 14
Improvement in Average Driver Safety Scores Increased trend in average driver scores 2017 to 2018 85 84.3484.16 84.17 83.41 84 82.98 82.93 82.79 82.58 82.49 83 82.24 82.08 82 81.72 81.59 81.45 82 81.3581.12 81.02 80.85 80.78 80.64 80.56 81 79.7679.48 80 79 78 77 17 Jul- 23 Jul 2017 24 Jul- 30 Jul 31 Jul- 6 Aug 7 Aug- 13 Aug 14 Aug- 20 Aug 21 Aug- 27 Aug 28 4 11 18 25 2 Oct- 8 Oct 9 Oct- 15 Oct 16 Oct- 22 Oct 23 Oct- 29 Oct 30 6 13 Nov- 19 Nov 20 Nov- 26 Nov 27 Nov- 3 Dec 4 Dec- 10 Dec 11 Dec- 17 Dec 18 Dec- 24 Dec 25 Dec- 31 Dec Aug- 3 Sept Sept- 10 Sept Sept- 17 Sept Sept- 24 Sept Sept- 1 Oct Oct- 5 Nov Nov- 12 Nov 15
And The Fatigue Problem. We planned and implemented a Fatigue Management Program which commenced in December 2014. Initiatives included: Formation of a Driver Fatigue Risk Team with reps from each state. Distributed a Driver Fatigue Survey- Identified that 50% of our drivers were getting less than 5 hours sleep pre- shift. Developed a fatigue management booklet which we distributed to all our patrol men with an eye mask and ear plugs to raise awareness of fatigue as an issue. Included in the booklet was a letter from Jeff one of our Patrol Men who had a bad incident resulting from falling asleep at the wheel and ruptured his spleen, fatigue management information and an outline of a Sleep Management Ap called Sleep Time Rolled out a series of Sleep Webinars by Dr Carmel Harrington as toolboxes. 16
Injury Reduction Injuries (includes 3rd party) 10 9 9 8 7 6 6 5 5 4 3 3 3 2 2 2 1 0 2013 2014 2015 2016 2017 2018 2019 17
Additional Benefits Significant reduction in tyre replacement and wear and tear maintenance costs . Increased engagement due to demonstrated care factor Opportunity to use telematics data and driver average safety score to identify fatigue or health problems (a pattern of increased driver events on particular days or over particular time periods shows up in the data). 18
What are the Learnings? 1. Driver safety programs need to continually change and innovate, there is no set and forget and you haven t ever succeeded . 2. You need a number of tools in your kit so you can vary and refresh your program regularly. Telematics are a great worker engagement too and providers are building competition and gamification into their products and services. 3. Telematics data is an effective lead indicator but you need a comprehensive approach and additional lead indicators (driver assessments, training, investigations) 4. Senior leadership commitment (one champion will do it) and persistence are critical. 19
Questions 20