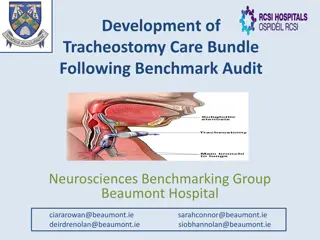
Transforming Acute Hospital Care: The Benefits of FIT Teams at the Front Door

FIT Teams, operating at the front door of acute hospitals, play a crucial role in addressing the challenges posed by an ageing population. With a focus on improving unscheduled care, these teams help enhance patient outcomes and reduce length of stay, particularly for elderly individuals. By investing in specialized care early on, such as frailty intervention and therapy, hospitals like Beaumont are revolutionizing emergency department services to meet the needs of a growing elderly population in North Dublin.

Download Presentation

Please find below an Image/Link to download the presentation.
The content on the website is provided AS IS for your information and personal use only. It may not be sold, licensed, or shared on other websites without obtaining consent from the author. Download presentation by click this link. If you encounter any issues during the download, it is possible that the publisher has removed the file from their server.
E N D
Presentation Transcript
The Benefits of FIT Teams Operating at the Front Door in Acute Hospitals Population Ageing A success story, not a catastrophe Unscheduled Care Forum September 4th, 2018 Paul Maloney Occupational Therapy Manager Beaumont Hospital
Future Demographics in North Dublin North Dublin Population over 65 years of age 45000 40000 35000 30000 25000 N over 65 years of age 20000 15000 10000 5000 0 2011 28860 2016 30919 2021 35751 2026 41550 N over 65years By 2026 there will be a 44% increase in the population of North Dublin >65 years
FRAILTY & the Emergency Department Liew found that length of stay in the emergency department independently predicted inpatient length of stay ED stay 4-8 hours increases inpatient length of stay by 1.3 days ED stay >12 hours increases inpatient length of stay by 2.35 days LiewD, LiewD, Kennedy M. Emergency Department Length of Stay Independently Predicts Inpatient Length of Stay. MJA 2003; 179; 524-526 3
65 yrs. presentations per month to Beaumont (Jan 2015-July 2018) 1,800 1,600 No. of Patients 65 yrs. 1,400 1,200 1,000 26% presentations (n=800) to ED 65 years Q1 2015 vs Q1 2018 800 600 400 2015-01 2015-07 2016-01 2016-07 2017-01 2017-07 2018-01 2018-07 2015-03 2015-05 2015-09 2015-11 2016-03 2016-05 Jan 2014-July 2018 2016-09 2016-11 2017-03 2017-05 2017-09 2017-11 2018-03 2018-05
FIT Team ED Physiotherapy Frailty Intervention Therapy Team Doctor OT SLT ED Nurse Pharmacy Social Work On-take team Dietetics Core working hours 8am-4pm Mon-Fri Every Hour Counts
Dedicated ED HSCP service Primary Care/ICT Services Identification of FRAIL Transforming Our Practice Rehabilitation and collaborative discharge planning commences on day 1 Generating early referrals to HSCP s Early assessment of physical, cognitive and functional ability Initiation of treatment on appropriate pathway
Total ED Presentations 75 yrs. vs FITT Patients 950 892 872 821 850 773 Approx 51% of 75 year old patients seen by FITT each month 750 No. of Patients 75 yrs. 679 650 550 457 444 Total ED 75 450 396 385 Seen by FITT 356 350 250 Mar-18 Apr-18 May-18 Jun-18 Jul-18
Presenting complaint of admitted vs non-admitted patients % 50 45 40 % of FITT Patients 35 30 25 20 Non-admitted 15 Admitted 10 5 0
Data Trends Impact on admitted patients Admission avoidance LTC Conversion
75 yrs.: ED Presentations 15.8% 771 780 760 No. of Presentation 75 yrs. 740 720 700 680 666 660 640 620 600 April 2014 April 2018
75 years: % of ED patients remaining at home (1st Representation to ED) 100 94 95 90 85 85 % of Patients 78 80 77 76 April 2014 75yrs 73 75 April 2018 75 yrs 71 70 67 Apr-2018 FITT 66 66 64 65 62 60 55 50 Day 7 Day 30 Day 60 Day 90
75 years: Cumulative Days at Home April 2014 vs April 2018 26500 2698 days spent at home for April 25818 26000 11.7% 25500 25000 Days spent at home 24500 24000 FITT Patients (April) : 13,479 days 23500 23120 23000 22500 22000 21500 Apr 2014 Apr 2018
75 yrs.: ED Complexity (Manchester Triage System) April 2014 vs April 2018 (No.) 450 No. of Patients 75 yrs. Presenting 400 394 400 43% 350 300 300 250 209 75 yrs April 2014 200 75 yrs April 2018 150 100 43 34 50 5 2 0 RED ORANGE Manchester Triage Categories YELLOW GREEN
FITT beds/Specialist Geriatric Wards (SGWs) Activity Jan-July (2016-2018) 700 629 31% Discharges 2016 vs 2018 No. of Patients Discharged 566 600 471 500 400 1.3 % Bed days 2016 vs 2018 300 200 100 0 2016 2017 Year 2018
75 years: LTC Conversion rate 55 Pt s less listed for LTC Jan- July 2018 (-2.3%) LTC bed approx 1400/week 12.0 % of 75 year olds admitted converting to LTC 11.0 10.0 9.0 8.0 7.0 6.0 5.0 Jan-June 2015 LTC conversion = 9.4% Jan-June 2018 LTC conversion = 7.1% 31% presentations (n=1117) to ED 75 years Jan-June 2015 vs Q1 2018 4.0 3.0 Feb Sep Nov Dec Feb Sep Nov Dec Feb Sep Nov Dec Feb Jan Jan Jan Jan Apr Apr Apr Apr Aug Aug Aug May Oct May Oct May Oct May Mar Mar Mar Mar Jun Jul Jun Jul Jun Jul Jun Jul 2015 2016 2017 2018
Why has it worked? Adding a therapy resource to the existing medical and nursing ED team i.e. Dr can focus on medicine, nurse on nursing. Therapists are used to crossing boundaries between hospital and community connecting patients to services Senior exec support initially a novel team, took a risk! Right people is critical Invested in clinical specialists, extensive experience in COE and understand the system Therapy leaders who develop a culture of embracing risk! Work hard on relationships and connections
Patient story What happened What could have happened Carer demands admission Patient admitted Becomes agitated (why am I here) Sedated Confusion No relatives at Ass. with DC Unable to manage at home Listed for LTC PC: Confusion Early Ax by OT,PT,SLT,Diet and MSW Medically cleared Discharge plan set Outreach visit Community supports Referral to Geriatrician Remained at home


")
 Activity")