Solving Systems of Linear Inequalities Graphically
Learn how to graph and solve systems of linear inequalities by representing solutions graphically. Understand concepts like solution region, boundary lines, inclusive and non-inclusive, and how to use test points to verify solutions. Follow step-by-step instructions to graph a system of inequalities and find the overlapping shaded region that represents the solutions.

Uploaded on Oct 06, 2024 | 0 Views
Download Presentation

Please find below an Image/Link to download the presentation.
The content on the website is provided AS IS for your information and personal use only. It may not be sold, licensed, or shared on other websites without obtaining consent from the author. Download presentation by click this link. If you encounter any issues during the download, it is possible that the publisher has removed the file from their server.
E N D
Presentation Transcript
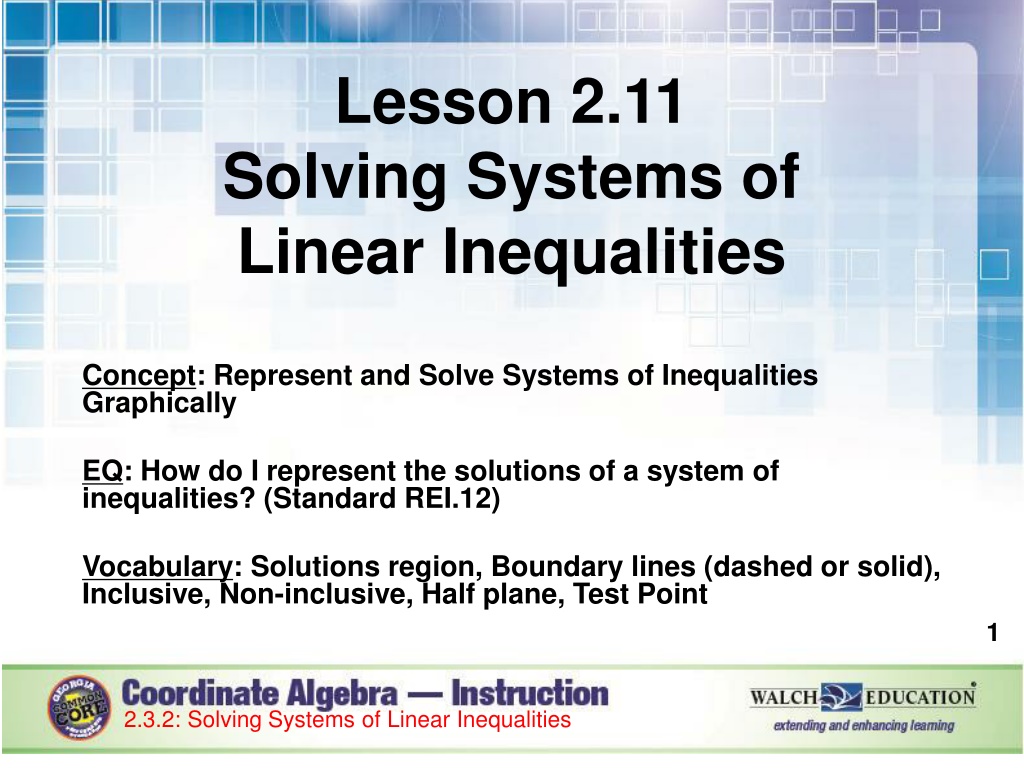
Lesson 2.11 Solving Systems of Linear Inequalities Concept: Represent and Solve Systems of Inequalities Graphically EQ: How do I represent the solutions of a system of inequalities? (Standard REI.12) Vocabulary: Solutions region, Boundary lines (dashed or solid), Inclusive, Non-inclusive, Half plane, Test Point 1 2.3.2: Solving Systems of Linear Inequalities
Key Concepts A system of inequalities is two or more inequalities in the same variables that work together. The solution to a system of linear inequalities is the set of all points that make all the inequalities in the system true. The solution region is the intersection of the half planes of the inequalities where they overlap (the darker shaded region). 2 2.3.2: Solving Systems of Linear Inequalities
Steps to Graphing a System of Linear Inequalities 1. Graph the first inequality as a linear equation. - Use a solid line for inclusive ( or ) - Use a dashed line for non-inclusive (< or >) 2. Shade the half plane above the y-intercept for (> and ). Shade the half plane below the y-intercept for (< and ). 3. Follow steps 1 and 2 for the second inequality. 4. The overlap of the two shaded regions represents the solutions to the system of inequalities. 5. Check your answer by picking a test point from the solutions region. If you get a true statement for both inequalities then your answer is correct. 3 2.3.2: Solving Systems of Linear Inequalities
Guided Practice - Example 1 Solve the following system of inequalities graphically: ? > ? + 10 1 2? 5 ? < 4 4 2.3.2: Solving Systems of Linear Inequalities
Guided Practice: Example 1, continued 1. Graph the line y = -x + 10. Use a dashed line because the inequality is non- inclusive (greater than). 2. Shade the solution set. Since the symbol > was used we will shade above the y- intercept. 5 2.3.2: Solving Systems of Linear Inequalities
Guided Practice: Example 1, continued ? ?? ? ? on the same 3. Graph the line ? = coordinate plane. Use a dashed line because the inequality is non- inclusive (less than). Shade the solution set.Since the symbol < was used we will shade below the y- intercept. 6 2.3.2: Solving Systems of Linear Inequalities
Guided Practice: Example 1, continued 4. Find the solutions to the system. The overlap of the two shaded regions, which is darker, represents the solutions to the system: ? > ? + 10 1 2? 5 ? < 4 5. Check your answer. Verify that (14, 2) is a solution to the system. Substitute it into both inequalities to see if you get a true statement for both. 7 2.3.2: Solving Systems of Linear Inequalities
Guided Practice: Example 1, continued 8 2.3.2: Solving Systems of Linear Inequalities
Guided Practice - Example 2 Solve the following system of inequalities graphically: ? > ? 10 ? > 3? +4 9 2.3.2: Solving Systems of Linear Inequalities
Guided Practice: Example 2, continued 1. Graph the line y = x 10. Use a dashed line because the inequality is non- inclusive (greater than). 2. Shade the solution set. Since the symbol > was used we will shade above the y- intercept. 10 2.3.2: Solving Systems of Linear Inequalities
Guided Practice: Example 2, continued 3. Graph the line ? = ?? + ? on the same coordinate plane. Use a dashed line because the inequality is non- inclusive (greater than). Shade the solution set.Since the symbol > was used we will shade above the y- intercept. 11 2.3.2: Solving Systems of Linear Inequalities
Guided Practice: Example 2, continued 4. Find the solutions to the system. The overlap of the two shaded regions, which is darker, represents the solutions to the system: ? > ? 10 ? > 3? +4 5. Check your answer. Verify that (3, 3) is a solution to the system. Substitute it into both inequalities to see if you get a true statement for both. 12 2.3.2: Solving Systems of Linear Inequalities
Guided Practice: Example 2, continued 13 2.3.2: Solving Systems of Linear Inequalities
Guided Practice - Example 3 Solve the following system of inequalities graphically: 4x + y 2 y -2 14 2.3.2: Solving Systems of Linear Inequalities
Guided Practice: Example 3, continued 1. Graph the line 4x + y = 2. Use a solid line because the inequality is inclusive (less than or equal to). Change to slope- intercept form: y = -4x + 2 2. Shade the solution set. Since the symbol was used we will shade below the y- intercept. 15 2.3.2: Solving Systems of Linear Inequalities
Guided Practice: Example 3, continued 3. Graph the line y = -2 on the same coordinate plane. Use a solid line because the inequality is inclusive (greater than or equal to). Shade the solution set.Since the symbol was used we will shade above the y- intercept. 16 2.3.2: Solving Systems of Linear Inequalities
Guided Practice: Example 3, continued 4. Find the solutions to the system. The overlap of the two shaded regions, which is darker, represents the solutions to the system: 4x + y 2 y -2 5. Check your answer. Verify that (0, -1) is a solution to the system. Substitute it into both inequalities to see if you get a true statement for both. 17 2.3.2: Solving Systems of Linear Inequalities
Guided Practice: Example 3, continued 18 2.3.2: Solving Systems of Linear Inequalities
You Try! Graph the following system of inequalities x -3 ? < 1. 2. y -x 2 y + 5x 2 5 3? + 2 19 2.3.2: Solving Systems of Linear Inequalities